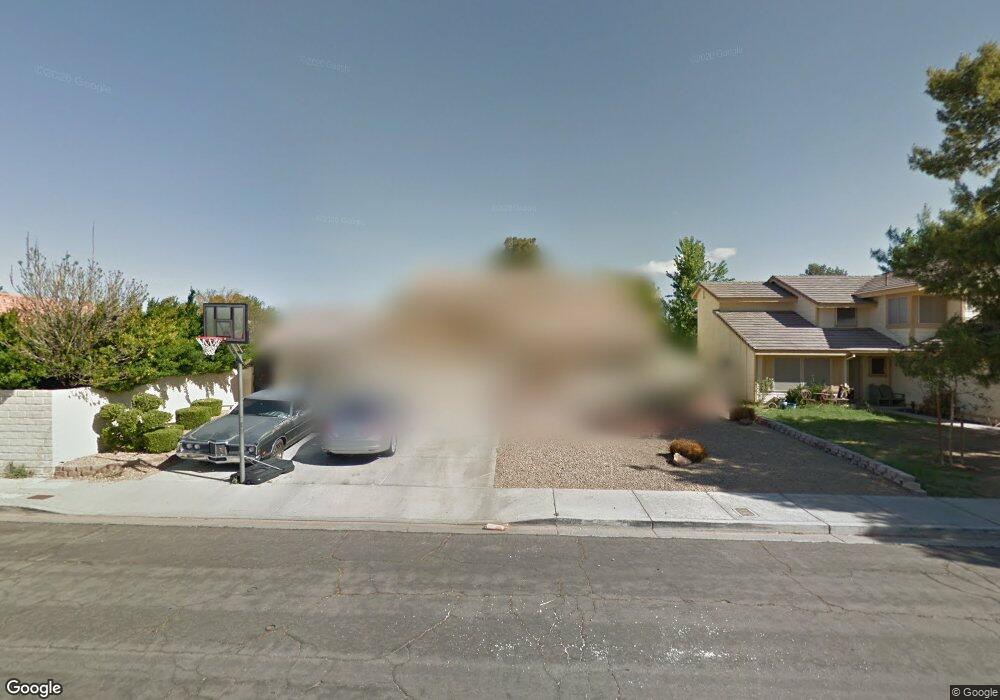
3138 Viewcrest Ave Henderson, NV 89014
Green Valley North NeighborhoodEstimated Value: $488,000 - $540,000
4
Beds
3
Baths
2,146
Sq Ft
$241/Sq Ft
Est. Value
About This Home
This home is located at 3138 Viewcrest Ave, Henderson, NV 89014 and is currently estimated at $517,822, approximately $241 per square foot. 3138 Viewcrest Ave is a home located in Clark County with nearby schools including Nate Mack Elementary School, Barbara and Hank Greenspun Junior High School, and Green Valley High School.
Ownership History
Date
Name
Owned For
Owner Type
Purchase Details
Closed on
Oct 8, 2008
Sold by
Empire Capital Investments Llc
Bought by
Aburto Carlos
Current Estimated Value
Home Financials for this Owner
Home Financials are based on the most recent Mortgage that was taken out on this home.
Original Mortgage
$163,780
Interest Rate
5.9%
Mortgage Type
Unknown
Purchase Details
Closed on
Jul 3, 2008
Sold by
Deutsche Bank National Trust Co
Bought by
Empire Capital Investment Llc
Purchase Details
Closed on
Dec 19, 2007
Sold by
Mazza Donna M and Mazza Angela
Bought by
Deutsche Bank National Trust Co and Hsi Asset Securitization Corp 2006-Opt4
Purchase Details
Closed on
Oct 24, 2003
Sold by
Mazza Donna M
Bought by
Mazza Donna M and Mazza Angela
Home Financials for this Owner
Home Financials are based on the most recent Mortgage that was taken out on this home.
Original Mortgage
$193,500
Interest Rate
7.45%
Mortgage Type
Unknown
Create a Home Valuation Report for This Property
The Home Valuation Report is an in-depth analysis detailing your home's value as well as a comparison with similar homes in the area
Home Values in the Area
Average Home Value in this Area
Purchase History
| Date | Buyer | Sale Price | Title Company |
|---|---|---|---|
| Aburto Carlos | $280,000 | First American Title Paseo V | |
| Empire Capital Investment Llc | $150,000 | First American Title Howard | |
| Deutsche Bank National Trust Co | $274,633 | Fidelity National Title Agen | |
| Mazza Donna M | -- | Fidelity National Title |
Source: Public Records
Mortgage History
| Date | Status | Borrower | Loan Amount |
|---|---|---|---|
| Previous Owner | Aburto Carlos | $163,780 | |
| Previous Owner | Mazza Donna M | $193,500 |
Source: Public Records
Tax History
| Year | Tax Paid | Tax Assessment Tax Assessment Total Assessment is a certain percentage of the fair market value that is determined by local assessors to be the total taxable value of land and additions on the property. | Land | Improvement |
|---|---|---|---|---|
| 2026 | $2,074 | $94,627 | $39,200 | $55,427 |
| 2025 | $2,013 | $95,219 | $37,450 | $57,769 |
| 2024 | $1,955 | $95,219 | $37,450 | $57,769 |
| 2023 | $1,955 | $91,062 | $35,350 | $55,712 |
| 2022 | $1,898 | $82,268 | $30,590 | $51,678 |
| 2021 | $1,843 | $76,283 | $26,600 | $49,683 |
| 2020 | $1,786 | $74,425 | $24,500 | $49,925 |
| 2019 | $1,734 | $71,625 | $22,050 | $49,575 |
| 2018 | $1,684 | $68,035 | $19,950 | $48,085 |
| 2017 | $1,994 | $68,790 | $19,600 | $49,190 |
| 2016 | $1,595 | $64,254 | $14,350 | $49,904 |
| 2015 | $1,591 | $60,847 | $11,200 | $49,647 |
| 2014 | $1,545 | $59,833 | $9,625 | $50,208 |
Source: Public Records
Map
Nearby Homes
- 3146 White Rose Way
- 3150 White Rose Way
- 3185 La Mancha Way
- 3115 La Mancha Way
- 3193 La Mancha Way
- 3205 La Mancha Way
- 3102 La Mancha Way
- 3201 La Mancha Way
- 10 Pheasant Ridge Cir
- 8 Hummingbird Ln
- 2215 Heavenly View Dr
- 128 Quail Run Rd
- 3135 La Mesa Dr
- 37 Pheasant Ridge Dr
- 112 Quail Run Rd
- 2347 Pickwick Dr
- 2349 Pickwick Dr Unit 91
- 2413 Muirfield Ave
- 2249 Darwin Cir
- 3158 La Luna Cir
- 3136 Viewcrest Ave
- 2332 Valleywood St
- 2334 Valleywood St
- 3134 Viewcrest Ave
- 2337 Red Willow Ln
- 2339 Red Willow Ln
- 2336 Valleywood St
- 3139 Viewcrest Ave Unit 3
- 3141 Viewcrest Ave
- 3137 Viewcrest Ave
- 3132 Viewcrest Ave
- 2338 Valleywood St
- 3135 Viewcrest Ave
- 3143 Viewcrest Ave
- 2338 Valleywood Rd Unit N
- 2338 Valleywood Rd
- 2338 Red Willow Ln
- 2331 Valleywood St
- 3145 Viewcrest Ave
- 3133 Viewcrest Ave
Your Personal Tour Guide
Ask me questions while you tour the home.