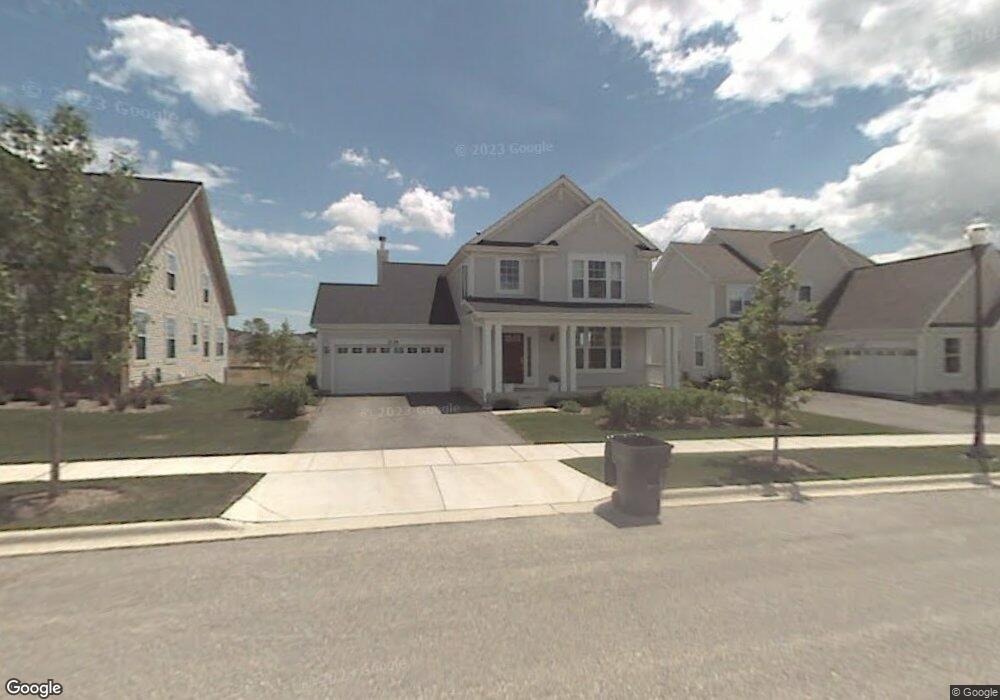
3139 Concord Ln Wadsworth, IL 60083
Estimated Value: $452,000 - $496,000
3
Beds
3
Baths
2,756
Sq Ft
$170/Sq Ft
Est. Value
About This Home
This home is located at 3139 Concord Ln, Wadsworth, IL 60083 and is currently estimated at $467,500, approximately $169 per square foot. 3139 Concord Ln is a home located in Lake County with nearby schools including Spaulding Elementary School, Viking Middle School, and Warren Township High School.
Ownership History
Date
Name
Owned For
Owner Type
Purchase Details
Closed on
May 27, 2009
Sold by
Sacco John
Bought by
Richardson Beverly
Current Estimated Value
Home Financials for this Owner
Home Financials are based on the most recent Mortgage that was taken out on this home.
Original Mortgage
$274,928
Outstanding Balance
$174,451
Interest Rate
4.85%
Mortgage Type
FHA
Estimated Equity
$293,049
Purchase Details
Closed on
Apr 14, 2008
Sold by
Vande Wyngard Vanessa
Bought by
Sacco John
Purchase Details
Closed on
Jul 28, 2006
Sold by
Concord Homes Inc
Bought by
Sacco John and Vandewyngard Vanessa
Home Financials for this Owner
Home Financials are based on the most recent Mortgage that was taken out on this home.
Original Mortgage
$178,900
Interest Rate
6.78%
Mortgage Type
Unknown
Create a Home Valuation Report for This Property
The Home Valuation Report is an in-depth analysis detailing your home's value as well as a comparison with similar homes in the area
Home Values in the Area
Average Home Value in this Area
Purchase History
| Date | Buyer | Sale Price | Title Company |
|---|---|---|---|
| Richardson Beverly | $280,000 | Fort Dearborn Land Title Llc | |
| Sacco John | -- | None Available | |
| Sacco John | $289,000 | None Available |
Source: Public Records
Mortgage History
| Date | Status | Borrower | Loan Amount |
|---|---|---|---|
| Open | Richardson Beverly | $274,928 | |
| Previous Owner | Sacco John | $178,900 |
Source: Public Records
Tax History Compared to Growth
Tax History
| Year | Tax Paid | Tax Assessment Tax Assessment Total Assessment is a certain percentage of the fair market value that is determined by local assessors to be the total taxable value of land and additions on the property. | Land | Improvement |
|---|---|---|---|---|
| 2024 | $12,757 | $118,881 | $13,458 | $105,423 |
| 2023 | $11,711 | $110,372 | $12,495 | $97,877 |
| 2022 | $11,711 | $99,802 | $13,977 | $85,825 |
| 2021 | $10,938 | $95,797 | $13,416 | $82,381 |
| 2020 | $10,771 | $93,442 | $13,086 | $80,356 |
| 2019 | $10,657 | $90,729 | $12,706 | $78,023 |
| 2018 | $12,267 | $103,915 | $19,523 | $84,392 |
| 2017 | $11,873 | $100,938 | $18,964 | $81,974 |
| 2016 | $11,551 | $96,444 | $18,120 | $78,324 |
| 2015 | $11,427 | $91,468 | $17,185 | $74,283 |
| 2014 | $11,582 | $84,172 | $16,953 | $67,219 |
| 2012 | $10,765 | $91,848 | $17,099 | $74,749 |
Source: Public Records
Map
Nearby Homes
- 3123 Concord Ln
- 5046 Nelson Ct
- 3077 Nicklaus Ln Unit 4
- 3006 Concord Ln Unit 1217
- 4584 Hogan Ln Unit 4584
- 3015 Monterey Ln
- 3270 Cashmore Rd
- 4750 Crest Ct
- 3163 N Augusta Dr
- 4747 W Pebble Beach Dr
- 3175 N Magnolia Ln
- 3111 Mini Dr
- 4827 W Pebble Beach Dr
- 4837 Dorothy Ct
- 37371 N Shirley Dr
- 38148 N Helena Ln
- 2625 Shirley Dr Unit H1
- 36847 N Delany Rd
- 38715 N Red Oak Terrace
- 13377 W Blanchard Rd
- 3135 Concord Ln
- 3143 Concord Ln
- 3130 Chandler Ln
- 3126 Chandler Ln
- 3129 Concord Ln
- 3134 Chandler Ln
- 3122 Chandler Ln
- 3149 Chandler Ln
- 3140 Concord Ln
- 3136 Concord Ln
- 3145 Chandler Ln
- 3141 Chandler Ln
- 3128 Concord Ln
- 3144 Concord Ln
- 3118 Chandler Ln
- 3132 Concord Ln
- 3117 Concord Ln
- 3114 Chandler Ln
- 5054 Nelson Ct
- 3152 Concord Ln