Estimated Value: $425,000 - $476,000
3
Beds
3
Baths
2,842
Sq Ft
$158/Sq Ft
Est. Value
About This Home
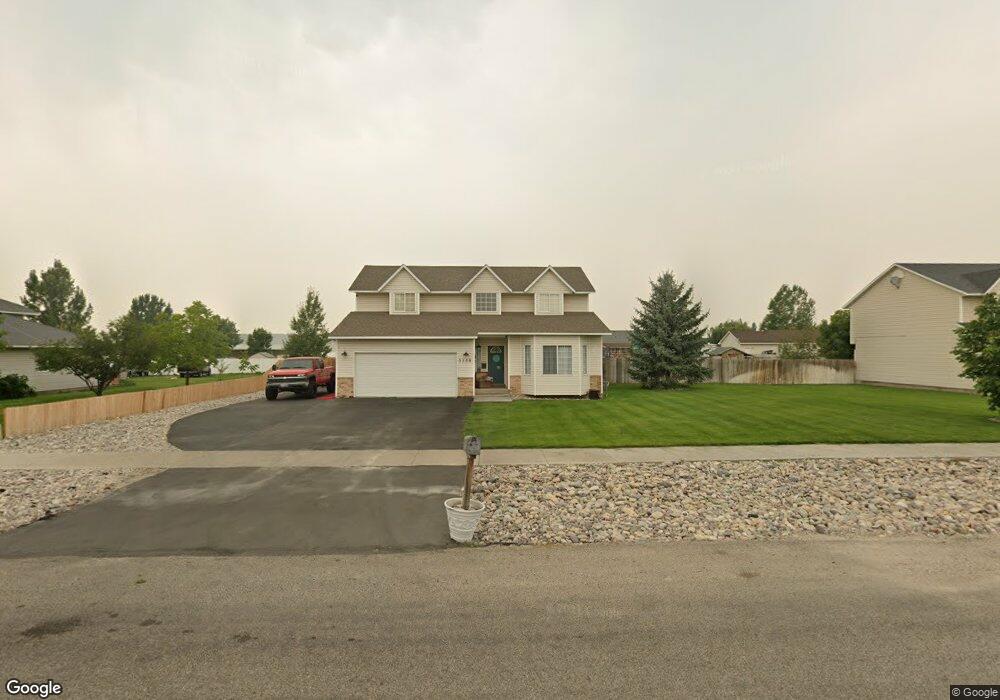
This home is located at 3139 N Barnes Way, Iona, ID 83427 and is currently estimated at $448,141, approximately $157 per square foot. 3139 N Barnes Way is a home located in Bonneville County with nearby schools including Iona Elementary School, Rocky Mountain Middle School, and Bonneville High School.
Ownership History
Date
Name
Owned For
Owner Type
Purchase Details
Closed on
Apr 23, 2021
Sold by
Landon Tanner
Bought by
Landon Tanner and Nebeker Jenna Amanda
Current Estimated Value
Home Financials for this Owner
Home Financials are based on the most recent Mortgage that was taken out on this home.
Original Mortgage
$264,550
Outstanding Balance
$238,857
Interest Rate
3%
Mortgage Type
FHA
Estimated Equity
$209,284
Purchase Details
Closed on
Jan 20, 2010
Sold by
Schwartz Heather R and Schwartz David M
Bought by
Landon Tanner
Home Financials for this Owner
Home Financials are based on the most recent Mortgage that was taken out on this home.
Original Mortgage
$166,224
Interest Rate
4.78%
Mortgage Type
New Conventional
Purchase Details
Closed on
Jan 15, 2010
Sold by
Nebeker Jenna Amanda
Bought by
Landon Tanner
Home Financials for this Owner
Home Financials are based on the most recent Mortgage that was taken out on this home.
Original Mortgage
$166,224
Interest Rate
4.78%
Mortgage Type
New Conventional
Create a Home Valuation Report for This Property
The Home Valuation Report is an in-depth analysis detailing your home's value as well as a comparison with similar homes in the area
Home Values in the Area
Average Home Value in this Area
Purchase History
| Date | Buyer | Sale Price | Title Company |
|---|---|---|---|
| Landon Tanner | -- | First American Ttl Id Falls | |
| Landon Tanner | -- | -- | |
| Landon Tanner | -- | -- | |
| Landon Tanner | -- | -- |
Source: Public Records
Mortgage History
| Date | Status | Borrower | Loan Amount |
|---|---|---|---|
| Open | Landon Tanner | $264,550 | |
| Closed | Landon Tanner | $166,224 |
Source: Public Records
Tax History Compared to Growth
Tax History
| Year | Tax Paid | Tax Assessment Tax Assessment Total Assessment is a certain percentage of the fair market value that is determined by local assessors to be the total taxable value of land and additions on the property. | Land | Improvement |
|---|---|---|---|---|
| 2025 | $2,029 | $565,064 | $91,202 | $473,862 |
| 2024 | $2,029 | $481,852 | $58,881 | $422,971 |
| 2023 | $1,814 | $375,391 | $58,881 | $316,510 |
| 2022 | $2,409 | $360,311 | $51,201 | $309,110 |
| 2021 | $2,337 | $268,641 | $51,201 | $217,440 |
| 2019 | $2,357 | $225,610 | $37,600 | $188,010 |
| 2018 | $1,988 | $256,760 | $34,240 | $222,520 |
| 2017 | $1,788 | $226,330 | $28,480 | $197,850 |
| 2016 | $1,858 | $212,140 | $28,480 | $183,660 |
| 2015 | $1,813 | $203,090 | $27,040 | $176,050 |
| 2014 | $34,175 | $203,090 | $27,040 | $176,050 |
| 2013 | $1,267 | $148,650 | $27,040 | $121,610 |
Source: Public Records
Map
Nearby Homes
- 3142 Quaky Aspen Dr
- The Scotty Plan at Elim Estates
- The Dornie Plan at Elim Estates
- The Halkirk Plan at Elim Estates
- The William Plan at Elim Estates
- The Montgomery Plan at Elim Estates
- 3603 N Elim Ln
- 5174 Scoresby Ave
- 4777 E Miles Dr
- TBD Tbd
- 5311 E Dutson
- 5160 E Hansen Ave
- 2850 Sable Chase Rd
- 4405 Cordoba Ln
- 5083 Brylee Way
- 4407 E Arcadia Ave
- 5194 E Nelson Dr
- 4372 E Arcadia Ave
- 4391 E Arcadia Ave
- 5409 E Elliott St
- 3139 Barnes Way
- 3171 Barnes Way
- 3107 Barnes Way
- 3134 Alder Cir
- 3166 Alder Cir
- 3203 Barnes Way
- 3100 Alder Cir
- 4890 Camas Creek Cir
- 3110 Barnes Way
- 3200 Alder Cir
- 3235 Barnes Way
- 3222 Alder Cir
- 3075 Barnes Way
- 4910 Camas Creek Cir
- 4893 Camas Creek Cir
- 4915 Denning Ave
- 3070 Lilac Cir
- 3141 Alder Cir
- 3175 Alder Cir
- 3103 Alder Cir