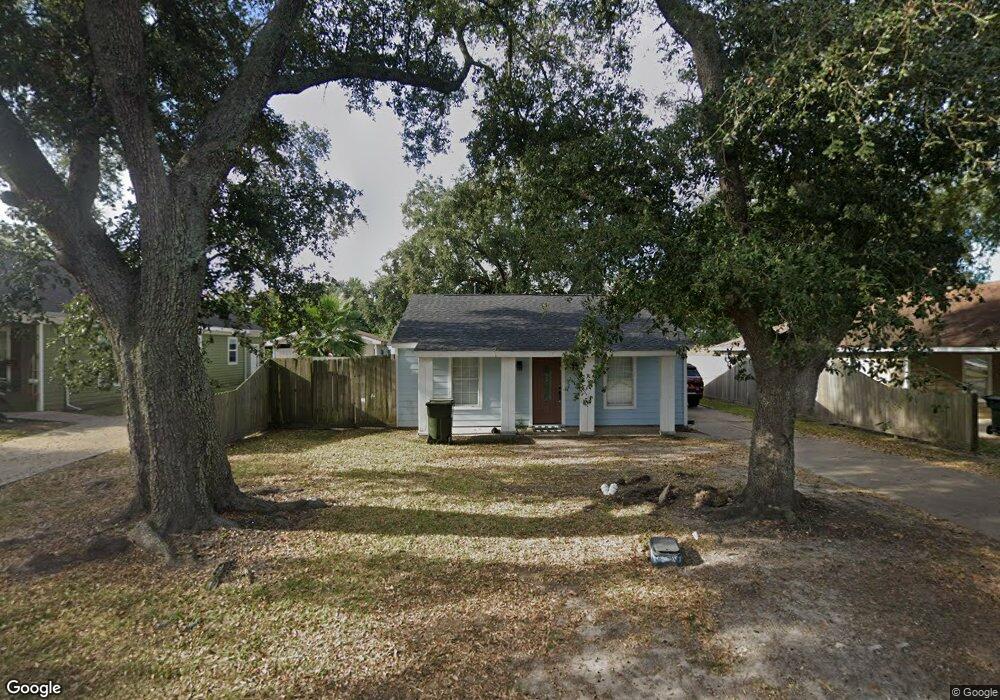
3139 Tyler Ave Port Arthur, TX 77640
Estimated Value: $70,000 - $95,000
2
Beds
1
Bath
1,066
Sq Ft
$77/Sq Ft
Est. Value
About This Home
This home is located at 3139 Tyler Ave, Port Arthur, TX 77640 and is currently estimated at $82,513, approximately $77 per square foot. 3139 Tyler Ave is a home located in Jefferson County with nearby schools including Houston Elementary School, Abraham Lincoln Middle School, and Memorial High School.
Ownership History
Date
Name
Owned For
Owner Type
Purchase Details
Closed on
Jun 20, 2018
Sold by
Leblanc Fernando and Leblanc Maryanne
Bought by
Lerma Miguel Angel and Lerma Janett
Current Estimated Value
Home Financials for this Owner
Home Financials are based on the most recent Mortgage that was taken out on this home.
Original Mortgage
$223,250
Outstanding Balance
$193,074
Interest Rate
4.5%
Mortgage Type
New Conventional
Estimated Equity
-$110,561
Purchase Details
Closed on
May 17, 2010
Sold by
Dela Cruz Ovidio and De La Cruz Sayde
Bought by
Lerma Miguel A
Home Financials for this Owner
Home Financials are based on the most recent Mortgage that was taken out on this home.
Original Mortgage
$56,654
Interest Rate
5.02%
Mortgage Type
FHA
Purchase Details
Closed on
Nov 24, 2009
Sold by
Briesch John James and Briesch Carolyn Ruth
Bought by
Delacruz Ovidio and Delacruz Sayde
Create a Home Valuation Report for This Property
The Home Valuation Report is an in-depth analysis detailing your home's value as well as a comparison with similar homes in the area
Home Values in the Area
Average Home Value in this Area
Purchase History
| Date | Buyer | Sale Price | Title Company |
|---|---|---|---|
| Lerma Miguel Angel | -- | Stewart Title | |
| Lerma Miguel A | -- | None Available | |
| Delacruz Ovidio | -- | None Available |
Source: Public Records
Mortgage History
| Date | Status | Borrower | Loan Amount |
|---|---|---|---|
| Open | Lerma Miguel Angel | $223,250 | |
| Previous Owner | Lerma Miguel A | $56,654 |
Source: Public Records
Tax History Compared to Growth
Tax History
| Year | Tax Paid | Tax Assessment Tax Assessment Total Assessment is a certain percentage of the fair market value that is determined by local assessors to be the total taxable value of land and additions on the property. | Land | Improvement |
|---|---|---|---|---|
| 2025 | $2,262 | $80,242 | $6,364 | $73,878 |
| 2024 | $2,262 | $78,955 | $2,530 | $76,425 |
| 2023 | $2,262 | $67,894 | $2,530 | $65,364 |
| 2022 | $1,907 | $60,050 | $2,530 | $57,520 |
| 2021 | $1,957 | $59,046 | $2,530 | $56,516 |
| 2020 | $979 | $29,546 | $2,530 | $27,016 |
| 2019 | $484 | $29,550 | $2,530 | $27,020 |
| 2018 | $470 | $29,550 | $2,530 | $27,020 |
| 2017 | $450 | $29,550 | $2,530 | $27,020 |
| 2016 | $866 | $29,550 | $2,530 | $27,020 |
| 2015 | $672 | $32,920 | $2,530 | $30,390 |
| 2014 | $672 | $32,920 | $2,530 | $30,390 |
Source: Public Records
Map
Nearby Homes