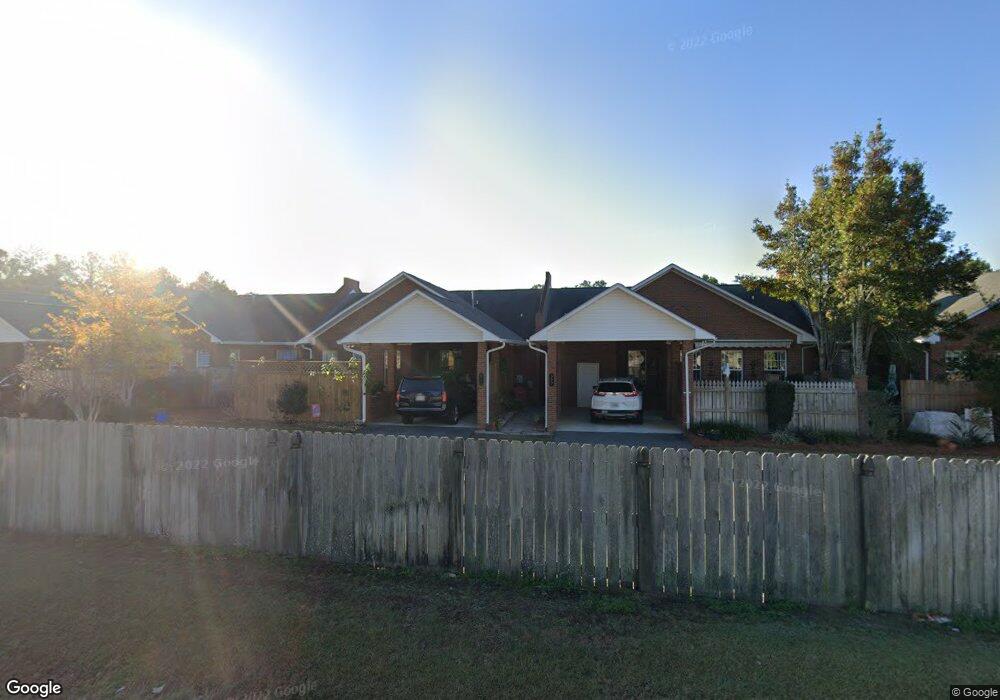
314 Allison's Way Tifton, GA 31794
Estimated Value: $237,000 - $271,000
2
Beds
2
Baths
1,675
Sq Ft
$152/Sq Ft
Est. Value
About This Home
This home is located at 314 Allison's Way, Tifton, GA 31794 and is currently estimated at $255,195, approximately $152 per square foot. 314 Allison's Way is a home located in Tift County with nearby schools including Northside Primary School, Charles Spencer Elementary School, and J.T. Reddick School.
Ownership History
Date
Name
Owned For
Owner Type
Purchase Details
Closed on
Jun 4, 2010
Sold by
Jones Florence C
Bought by
Harper Sherry F
Current Estimated Value
Home Financials for this Owner
Home Financials are based on the most recent Mortgage that was taken out on this home.
Original Mortgage
$60,000
Interest Rate
4.97%
Mortgage Type
New Conventional
Purchase Details
Closed on
Nov 2, 2004
Sold by
Mcbrayer Sharon T
Bought by
Jones Florence C
Purchase Details
Closed on
Jan 20, 2004
Sold by
Thompson Laton
Bought by
Mcbrayer Sharon T
Purchase Details
Closed on
Oct 29, 2001
Sold by
Lorence Joseph Harold
Bought by
Thompson Laton
Purchase Details
Closed on
Aug 31, 1999
Sold by
Wilkin James Henry
Bought by
Lorence Joseph Harold
Purchase Details
Closed on
Jul 29, 1998
Sold by
Garvey Peter M and Marbut Richard
Bought by
Wilkin James Henry and Linda Ross
Create a Home Valuation Report for This Property
The Home Valuation Report is an in-depth analysis detailing your home's value as well as a comparison with similar homes in the area
Home Values in the Area
Average Home Value in this Area
Purchase History
| Date | Buyer | Sale Price | Title Company |
|---|---|---|---|
| Harper Sherry F | $158,500 | -- | |
| Jones Florence C | $145,000 | -- | |
| Mcbrayer Sharon T | -- | -- | |
| Thompson Laton | $129,800 | -- | |
| Lorence Joseph Harold | $122,000 | -- | |
| Wilkin James Henry | $119,900 | -- |
Source: Public Records
Mortgage History
| Date | Status | Borrower | Loan Amount |
|---|---|---|---|
| Closed | Harper Sherry F | $60,000 |
Source: Public Records
Tax History Compared to Growth
Tax History
| Year | Tax Paid | Tax Assessment Tax Assessment Total Assessment is a certain percentage of the fair market value that is determined by local assessors to be the total taxable value of land and additions on the property. | Land | Improvement |
|---|---|---|---|---|
| 2024 | $2,602 | $100,344 | $12,000 | $88,344 |
| 2023 | $2,769 | $60,810 | $10,000 | $50,810 |
| 2022 | $2,139 | $60,810 | $10,000 | $50,810 |
| 2021 | $2,153 | $60,810 | $10,000 | $50,810 |
| 2020 | $2,088 | $57,789 | $10,000 | $47,789 |
| 2019 | $2,089 | $57,789 | $10,000 | $47,789 |
| 2018 | $2,089 | $57,789 | $10,000 | $47,789 |
| 2017 | $2,145 | $57,789 | $10,000 | $47,789 |
| 2016 | $2,148 | $57,789 | $10,000 | $47,789 |
| 2015 | $2,151 | $57,789 | $10,000 | $47,789 |
| 2014 | $2,154 | $57,789 | $10,000 | $47,789 |
| 2013 | -- | $57,788 | $10,000 | $47,788 |
Source: Public Records
Map
Nearby Homes
- 2214 Love Ave
- 2411 Davis Ave
- 2417 Belmont Ave
- 2020 Davis Ave
- 502 20th St E
- 2021 Davis Ave
- 705 20th St E
- 1809 Davis Ave
- 714 44th St E
- 2612 Goff St
- 1611 Love Ave
- 903 42nd St E
- 0 44th St E
- 717 E 44th St
- 0 Tift Ave
- 0 Central Ave Unit 138182
- 0 Central Ave Unit 137897
- 0 Central Ave Unit 137896
- 0 Central Ave Unit 137898
- 0 Central Ave Unit 137895
- 314 Allisons Way
- 312 Allisons Way
- 316 Allisons Way
- 310 Allisons Way
- 318 Allisons Way
- 308 Allisons Way
- 320 Allisons Way
- 307 26th St E
- 306 Allisons Way
- 311 Allisons Way
- 313 Allisons Way
- 322 Allisons Way
- 309 Allisons Way
- 315 Allisons Way
- 307 Allison's Way
- 307 Allisons Way
- 304 Allisons Way
- 317 Allisons Way
- 303 26th St E
- 305 Allisons Way