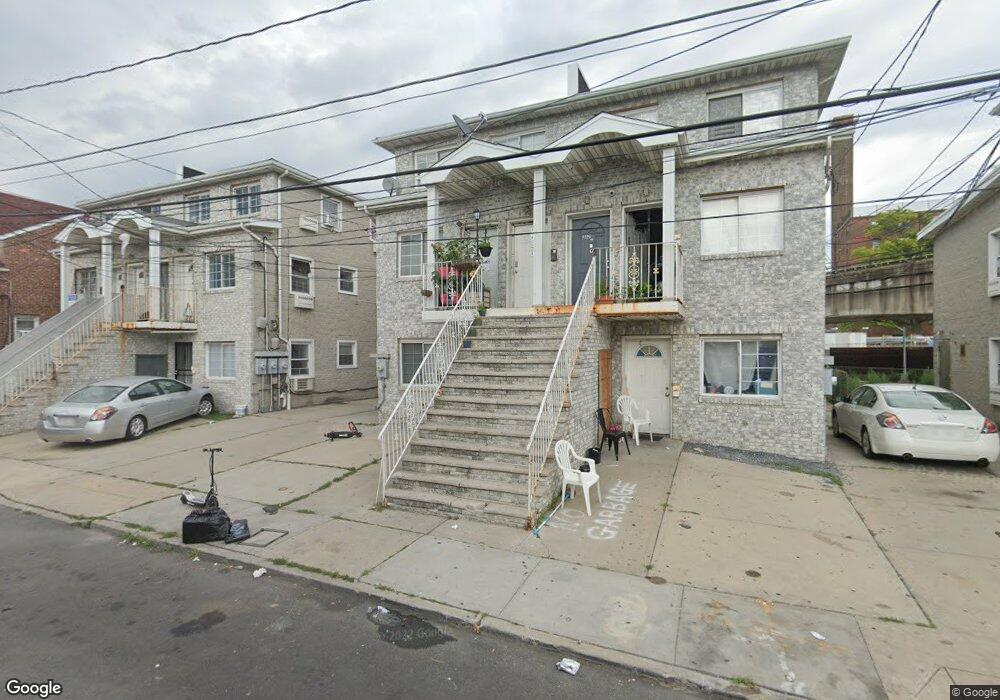
314 Beach 86th St Unit 3 Rockaway Beach, NY 11693
Rockaway Beach NeighborhoodEstimated Value: $674,686 - $1,152,000
--
Bed
2
Baths
2,475
Sq Ft
$365/Sq Ft
Est. Value
About This Home
This home is located at 314 Beach 86th St Unit 3, Rockaway Beach, NY 11693 and is currently estimated at $902,422, approximately $364 per square foot. 314 Beach 86th St Unit 3 is a home located in Queens County with nearby schools including P.S. 183 Dr Richard R Green and St Rose of Lima Catholic Academy.
Ownership History
Date
Name
Owned For
Owner Type
Purchase Details
Closed on
Apr 3, 2015
Sold by
Field Craig
Bought by
Chen Liang
Current Estimated Value
Purchase Details
Closed on
Mar 12, 2012
Sold by
Carrington Mortgage Loan Trust Series 2 and Wells Fargo Bank N A As Trustee
Bought by
Field Craig
Home Financials for this Owner
Home Financials are based on the most recent Mortgage that was taken out on this home.
Original Mortgage
$262,765
Interest Rate
3.86%
Mortgage Type
New Conventional
Purchase Details
Closed on
Mar 5, 2010
Sold by
Vitacco Esq As Referee Guy
Bought by
Wells Fargo Bank N A As Trustee For C
Purchase Details
Closed on
Mar 30, 2006
Sold by
Melendez Jenny R
Bought by
First Service Properties Inc
Create a Home Valuation Report for This Property
The Home Valuation Report is an in-depth analysis detailing your home's value as well as a comparison with similar homes in the area
Home Values in the Area
Average Home Value in this Area
Purchase History
| Date | Buyer | Sale Price | Title Company |
|---|---|---|---|
| Chen Liang | $445,000 | -- | |
| Chen Liang | $445,000 | -- | |
| Field Craig | $243,360 | -- | |
| Field Craig | $243,360 | -- | |
| Wells Fargo Bank N A As Trustee For C | $746,917 | -- | |
| Wells Fargo Bank N A As Trustee For C | $746,917 | -- | |
| First Service Properties Inc | -- | -- | |
| Khan Ashraf A | -- | -- | |
| First Service Properties Inc | -- | -- |
Source: Public Records
Mortgage History
| Date | Status | Borrower | Loan Amount |
|---|---|---|---|
| Previous Owner | Field Craig | $262,765 | |
| Closed | Khan Ashraf A | $0 |
Source: Public Records
Tax History Compared to Growth
Tax History
| Year | Tax Paid | Tax Assessment Tax Assessment Total Assessment is a certain percentage of the fair market value that is determined by local assessors to be the total taxable value of land and additions on the property. | Land | Improvement |
|---|---|---|---|---|
| 2025 | $7,945 | $41,933 | $8,911 | $33,022 |
| 2024 | $7,945 | $39,559 | $8,602 | $30,957 |
| 2023 | $7,496 | $37,320 | $8,924 | $28,396 |
| 2022 | $7,029 | $40,620 | $11,220 | $29,400 |
| 2021 | $7,410 | $43,440 | $11,220 | $32,220 |
| 2020 | $7,397 | $47,760 | $11,220 | $36,540 |
| 2019 | $6,896 | $40,920 | $11,220 | $29,700 |
| 2018 | $6,340 | $31,100 | $11,056 | $20,044 |
| 2017 | $5,981 | $29,340 | $11,220 | $18,120 |
| 2016 | $5,973 | $29,340 | $11,220 | $18,120 |
| 2015 | $4,576 | $30,120 | $12,480 | $17,640 |
| 2014 | $4,576 | $30,120 | $12,480 | $17,640 |
Source: Public Records
Map
Nearby Homes
- 308 Beach 86th St
- 227 Beach 86th St
- 355 D Dormans Ct Unit D
- 351 Beach 87th St
- 303 Beach 84th St
- 355 Dormans Ct
- 304 Beach 89th St
- 362 Beach 88th St
- 357 Beach 88th St
- 260 Beach 81st St Unit 6V
- 260 Beach 81st St Unit 1D
- 260 Beach 81st St Unit 6K
- 8918 Beach Channel Dr
- 221 Beach 80th St Unit 3D
- 221 Beach 80th St Unit 2J
- 177 Beach 90th St
- 309 Beach 91st St
- 181 Beach 91st St
- 79-14 Rockaway Beach Blvd Unit 3J
- 79-14 Rockaway Beach Blvd
- 314 Beach 86th St
- 314 Beach 86th St
- 314 Beach 86th St Unit 3
- 316 Beach 86th St
- 312 Beach 86th St
- 318 Beach 86th St
- 307 Beach 85th St
- 322 Beach 86th St
- 80-18 Java Place
- 309 Beach 85th St
- 84-10 Beach 85th St
- 84-16 Beach 85th St
- 330 Beach 86th St
- 311 Beach 85th St
- 313 Beach 86th St
- 311 Beach 86th St
- 317 Beach 86th St
- 309 Beach 86th St
- 321 Beach 86th St
- 321 Beach 86th St