Estimated Value: $357,000 - $378,000
--
Bed
2
Baths
1,607
Sq Ft
$229/Sq Ft
Est. Value
About This Home
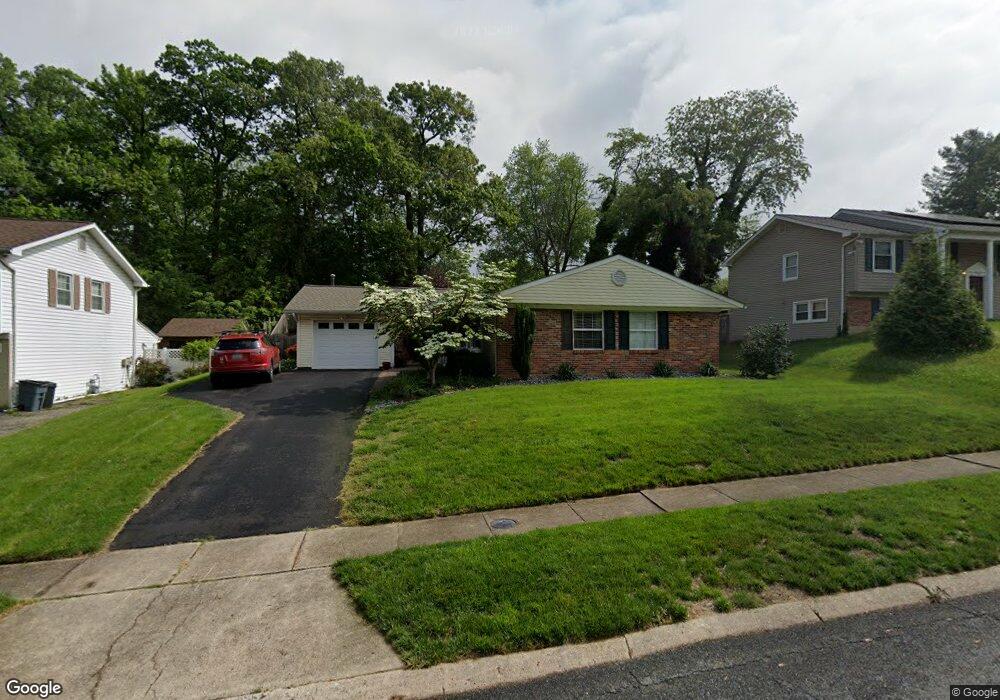
This home is located at 314 Blackburn Ct, Joppa, MD 21085 and is currently estimated at $368,273, approximately $229 per square foot. 314 Blackburn Ct is a home located in Harford County with nearby schools including Riverside Elementary School, Magnolia Middle School, and Joppatowne High School.
Ownership History
Date
Name
Owned For
Owner Type
Purchase Details
Closed on
Nov 20, 2024
Sold by
Kohler Michael and Kohler Jan
Bought by
Kohler Jan and Kohler Michael
Current Estimated Value
Purchase Details
Closed on
Oct 23, 2007
Sold by
Preisinger Wendy L
Bought by
Kohler Michael and Kohler Jan
Purchase Details
Closed on
Oct 12, 2007
Sold by
Preisinger Wendy L
Bought by
Kohler Michael and Kohler Jan
Purchase Details
Closed on
Sep 27, 2006
Sold by
Morris Robert J
Bought by
Preisinger Wendy L and Preisinger Michael S
Purchase Details
Closed on
Jul 24, 2006
Sold by
Morris Robert J
Bought by
Preisinger Wendy L and Preisinger Michael S
Purchase Details
Closed on
Aug 16, 2000
Sold by
Otter Creek L L C
Bought by
Nvr Inc
Purchase Details
Closed on
Jul 24, 1989
Sold by
Field Robert C
Bought by
Morris Robert J
Home Financials for this Owner
Home Financials are based on the most recent Mortgage that was taken out on this home.
Original Mortgage
$92,550
Interest Rate
9.87%
Create a Home Valuation Report for This Property
The Home Valuation Report is an in-depth analysis detailing your home's value as well as a comparison with similar homes in the area
Home Values in the Area
Average Home Value in this Area
Purchase History
| Date | Buyer | Sale Price | Title Company |
|---|---|---|---|
| Kohler Jan | -- | None Listed On Document | |
| Kohler Michael | $260,450 | -- | |
| Kohler Michael | $260,450 | -- | |
| Preisinger Wendy L | $138,008 | -- | |
| Preisinger Wendy L | $138,008 | -- | |
| Nvr Inc | $40,000 | -- | |
| Morris Robert J | $90,500 | -- |
Source: Public Records
Mortgage History
| Date | Status | Borrower | Loan Amount |
|---|---|---|---|
| Previous Owner | Morris Robert J | $92,550 |
Source: Public Records
Tax History Compared to Growth
Tax History
| Year | Tax Paid | Tax Assessment Tax Assessment Total Assessment is a certain percentage of the fair market value that is determined by local assessors to be the total taxable value of land and additions on the property. | Land | Improvement |
|---|---|---|---|---|
| 2025 | $2,476 | $243,200 | $0 | $0 |
| 2024 | $2,476 | $230,600 | $69,400 | $161,200 |
| 2023 | $2,357 | $219,033 | $0 | $0 |
| 2022 | $2,244 | $207,467 | $0 | $0 |
| 2021 | $2,205 | $195,900 | $69,400 | $126,500 |
| 2020 | $2,205 | $191,100 | $0 | $0 |
| 2019 | $2,150 | $186,300 | $0 | $0 |
| 2018 | $2,076 | $181,500 | $69,400 | $112,100 |
| 2017 | $1,988 | $181,500 | $0 | $0 |
| 2016 | -- | $166,100 | $0 | $0 |
| 2015 | $2,336 | $158,400 | $0 | $0 |
| 2014 | $2,336 | $158,400 | $0 | $0 |
Source: Public Records
Map
Nearby Homes
- 403 Dunfield Ct
- 304 Avedon Ct
- 408 Berkshire Ct
- 259 Foster Knoll Dr
- 404 Dunfield Ct
- 120 Haverhill Rd
- 225 Haverhill Rd
- 304 Foster Knoll Dr
- 233 Haverhill Rd
- 406 Fowler Ct
- 221 Kershaw Ct
- 343 Hackley Dr
- 345 Hackley Dr
- 338 Hackley Dr
- 355 Hackley Dr
- 231 Joppa Farm Rd
- 116 Trails Way
- 509 Foster Knoll Dr
- 219 Kearney Dr
- 795 Magnolia Ridge Ct
- 312 Blackburn Ct
- 316 Blackburn Ct
- 306 Stillmeadow Dr
- 304 Stillmeadow Dr
- 308 Stillmeadow Dr
- 318 Blackburn Ct
- 310 Blackburn Ct
- 315 Blackburn Ct
- 323 Roxbury Ct
- 313 Blackburn Ct
- 302 Stillmeadow Dr
- 317 Blackburn Ct
- 325 Roxbury Ct
- 319 Roxbury Ct
- 300 Stillmeadow Dr
- 319 Blackburn Ct
- 321 Blackburn Ct
- 301 Stillmeadow Dr
- 320 Roxbury Ct
- 317 Roxbury Ct