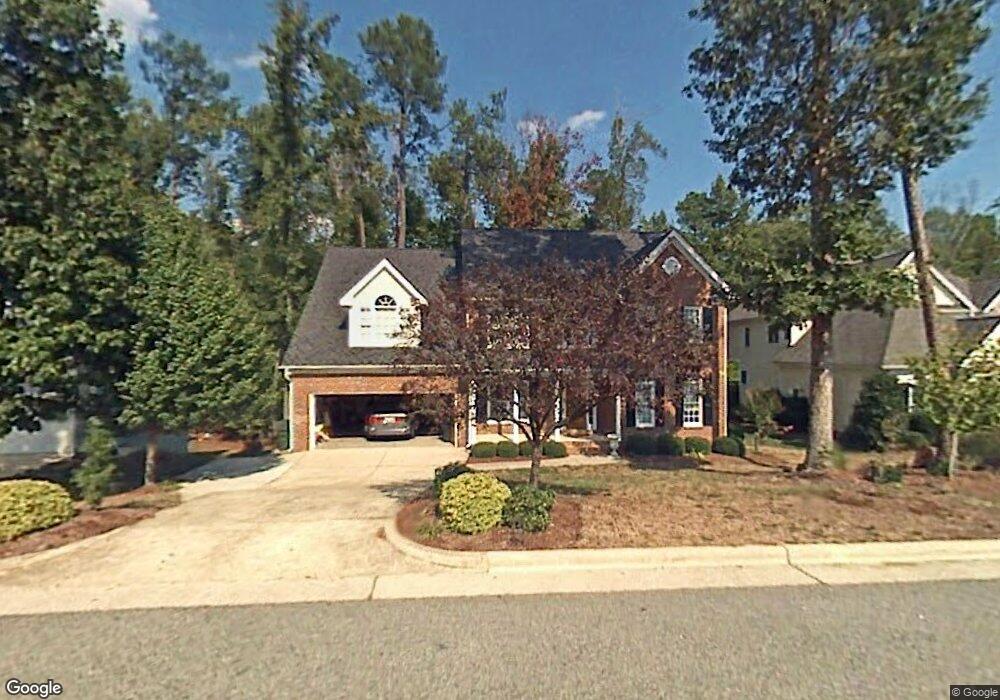
314 Burgwin Wright Way Cary, NC 27519
West Cary NeighborhoodEstimated Value: $734,000 - $844,000
4
Beds
3
Baths
3,350
Sq Ft
$241/Sq Ft
Est. Value
About This Home
This home is located at 314 Burgwin Wright Way, Cary, NC 27519 and is currently estimated at $807,124, approximately $240 per square foot. 314 Burgwin Wright Way is a home located in Wake County with nearby schools including Salem Elementary, Salem Middle, and Green Hope High.
Ownership History
Date
Name
Owned For
Owner Type
Purchase Details
Closed on
Apr 3, 2017
Sold by
Brindis Samuel B and Brindis Sandra B
Bought by
Brindis Sanuel B and Brindis Sandra B
Current Estimated Value
Purchase Details
Closed on
Jun 8, 2005
Sold by
Cendant Mobility Financial Corp
Bought by
Brindis Samuel B and Brindis Sandra B
Home Financials for this Owner
Home Financials are based on the most recent Mortgage that was taken out on this home.
Original Mortgage
$170,000
Outstanding Balance
$88,178
Interest Rate
5.66%
Mortgage Type
Fannie Mae Freddie Mac
Estimated Equity
$718,946
Purchase Details
Closed on
Apr 15, 2005
Sold by
Robbins Richard A and Robbins Rhonda J
Bought by
Cendant Mobility Financial Corp
Home Financials for this Owner
Home Financials are based on the most recent Mortgage that was taken out on this home.
Original Mortgage
$170,000
Outstanding Balance
$88,178
Interest Rate
5.66%
Mortgage Type
Fannie Mae Freddie Mac
Estimated Equity
$718,946
Create a Home Valuation Report for This Property
The Home Valuation Report is an in-depth analysis detailing your home's value as well as a comparison with similar homes in the area
Home Values in the Area
Average Home Value in this Area
Purchase History
| Date | Buyer | Sale Price | Title Company |
|---|---|---|---|
| Brindis Sanuel B | -- | None Available | |
| Brindis Samuel B | $393,000 | -- | |
| Cendant Mobility Financial Corp | $393,000 | -- |
Source: Public Records
Mortgage History
| Date | Status | Borrower | Loan Amount |
|---|---|---|---|
| Open | Brindis Samuel B | $170,000 |
Source: Public Records
Tax History
| Year | Tax Paid | Tax Assessment Tax Assessment Total Assessment is a certain percentage of the fair market value that is determined by local assessors to be the total taxable value of land and additions on the property. | Land | Improvement |
|---|---|---|---|---|
| 2025 | -- | $740,284 | $242,000 | $498,284 |
| 2024 | $6,227 | $740,284 | $242,000 | $498,284 |
Source: Public Records
Map
Nearby Homes
- 308 Burgwin Wright Way
- 306 Burgwin Wright Way
- 146 Swan Quarter Dr
- 217 Old Dock Trail
- 614 Gravel Brook Ct
- 103 Town Creek Dr
- 100 Wentbridge Rd
- 412 Brierley Dr
- 103 Jordan Creek Dr
- 105 Catchpenny Ct
- 106 Stokesay Ct
- 538 Rowanwood Way
- 416 Hopwood Way
- 620 Abbey Hall Way
- 266 Joshua Glen Ln
- 613 Abbey Hall Way
- 552 Rowanwood Way
- 104 Foxcrest Ct
- 110 Mereworth Place
- 502 Heathridge Ln
- 316 Burgwin Wright Way
- 312 Burgwin Wright Way
- 310 Burgwin Wright Way
- 318 Burgwin Wright Way
- 315 Burgwin Wright Way
- 311 Burgwin Wright Way
- 317 Burgwin Wright Way
- 320 Burgwin Wright Way
- 309 Burgwin Wright Way
- 111 Heck Andrews Way
- 321 Burgwin Wright Way
- 123 Swan Quarter Dr
- 510 Sherwood Forest Place
- 512 Sherwood Forest Place
- 121 Swan Quarter Dr
- 109 Heck Andrews Way
- 322 Burgwin Wright Way
- 112 Heck Andrews Way
- 508 Sherwood Forest Place
- 125 Swan Quarter Dr
Your Personal Tour Guide
Ask me questions while you tour the home.