Estimated Value: $288,000 - $343,000
3
Beds
3
Baths
1,614
Sq Ft
$190/Sq Ft
Est. Value
About This Home
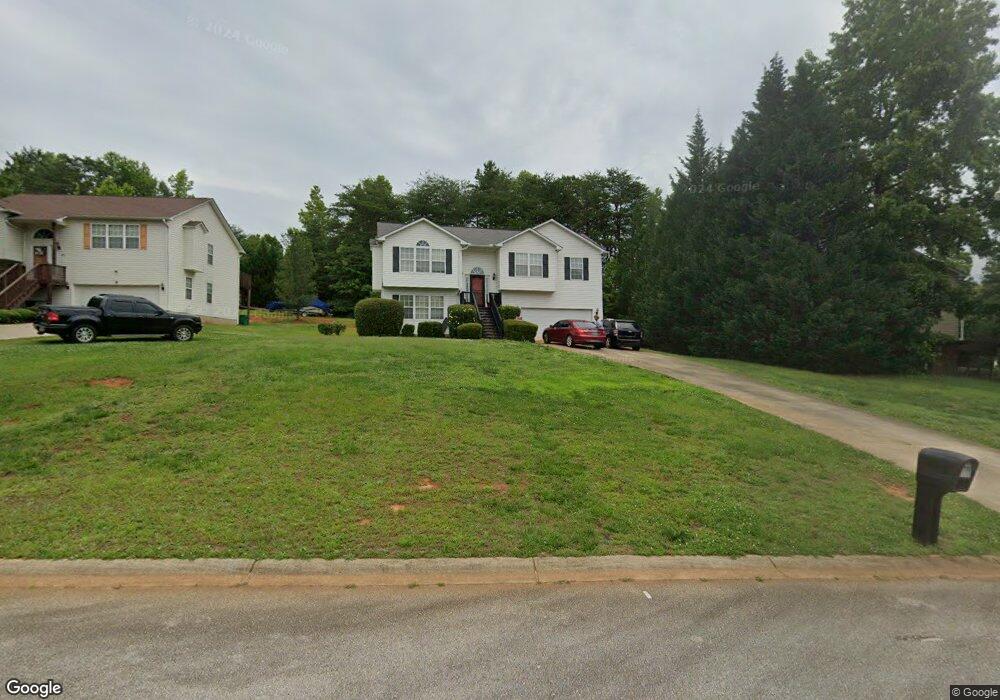
This home is located at 314 Cane Pole Walk, Inman, SC 29349 and is currently estimated at $306,729, approximately $190 per square foot. 314 Cane Pole Walk is a home located in Spartanburg County with nearby schools including Dorman High School Freshman Campus and Dorman High School.
Ownership History
Date
Name
Owned For
Owner Type
Purchase Details
Closed on
Aug 13, 2010
Sold by
Capitalbank
Bought by
Bryant Sylvia A
Current Estimated Value
Home Financials for this Owner
Home Financials are based on the most recent Mortgage that was taken out on this home.
Original Mortgage
$113,989
Outstanding Balance
$75,586
Interest Rate
4.6%
Mortgage Type
New Conventional
Estimated Equity
$231,143
Purchase Details
Closed on
Mar 22, 2010
Sold by
Durham Construction Inc
Bought by
Capitalbank
Purchase Details
Closed on
Jun 28, 2007
Sold by
Rogers Robert M and Rogers Mary H
Bought by
Durham Construction Inc
Home Financials for this Owner
Home Financials are based on the most recent Mortgage that was taken out on this home.
Original Mortgage
$168,300
Interest Rate
6.37%
Mortgage Type
Unknown
Purchase Details
Closed on
Oct 1, 2004
Sold by
Durham Construction Inc
Bought by
Rogers Robert M and Rogers Mary H
Create a Home Valuation Report for This Property
The Home Valuation Report is an in-depth analysis detailing your home's value as well as a comparison with similar homes in the area
Home Values in the Area
Average Home Value in this Area
Purchase History
| Date | Buyer | Sale Price | Title Company |
|---|---|---|---|
| Bryant Sylvia A | $110,000 | -- | |
| Capitalbank | $500 | -- | |
| Durham Construction Inc | $187,000 | None Available | |
| Rogers Robert M | $166,000 | -- |
Source: Public Records
Mortgage History
| Date | Status | Borrower | Loan Amount |
|---|---|---|---|
| Open | Bryant Sylvia A | $113,989 | |
| Previous Owner | Durham Construction Inc | $168,300 |
Source: Public Records
Tax History Compared to Growth
Tax History
| Year | Tax Paid | Tax Assessment Tax Assessment Total Assessment is a certain percentage of the fair market value that is determined by local assessors to be the total taxable value of land and additions on the property. | Land | Improvement |
|---|---|---|---|---|
| 2025 | $1,265 | $7,645 | $954 | $6,691 |
| 2024 | $1,265 | $7,645 | $954 | $6,691 |
| 2023 | $1,265 | $7,645 | $954 | $6,691 |
| 2022 | $1,172 | $6,648 | $920 | $5,728 |
| 2021 | $1,172 | $6,648 | $920 | $5,728 |
| 2020 | $1,152 | $6,648 | $920 | $5,728 |
| 2019 | $1,152 | $6,648 | $920 | $5,728 |
| 2018 | $1,152 | $6,648 | $920 | $5,728 |
| 2017 | $998 | $5,812 | $920 | $4,892 |
| 2016 | $998 | $5,812 | $920 | $4,892 |
| 2015 | $993 | $5,812 | $920 | $4,892 |
| 2014 | $960 | $5,812 | $920 | $4,892 |
Source: Public Records
Map
Nearby Homes
- 214 Cooleys Crest Ln
- 738 New Ct S
- 730 New Ct S
- The Artic Plan at Emerald Ridge
- The Pellum Plan at Emerald Ridge
- The Deerview Plan at Emerald Ridge
- 726 New Ct S
- The Hampton Plan at Emerald Ridge
- The Belue Plan at Emerald Ridge
- The Bishop Plan at Emerald Ridge
- 734 New Ct S
- 273 State Road S-42-742
- 271 State Road S-42-742
- 269 State Road S-42-742
- 338 Jordan Creek Rd
- 265 State Road S-42-742
- 261 State Road S-42-742
- 259 State Road S-42-742
- 257 State Road S-42-742
- 318 Cane Pole Walk
- 710 Jordan Creek Rd
- 322 Cane Pole Walk
- 690 Jordan Creek Rd
- 319 Cane Pole Walk
- 311 Cane Pole Walk
- 307 Cane Pole Walk
- 326 Cane Pole Walk
- 325 Cane Pole Walk
- 711 Jordan Creek Rd
- 207 Cooleys Crest Ln
- 689 Jordan Creek Rd
- 750 Jordan Creek Rd
- 680 Jordan Creek Rd
- 315 Cane Pole Walk
- 330 Cane Pole Walk
- 721 Jordan Creek Rd
- 329 Cane Pole Walk
- 681 Jordan Creek Rd
- 211 Cooleys Crest Ln