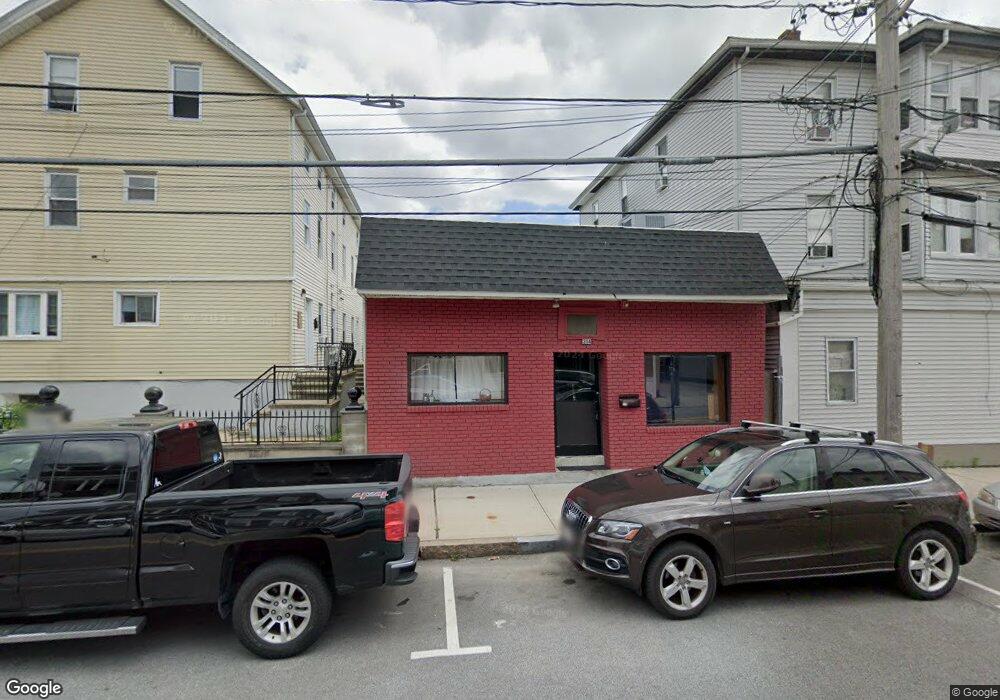
314 E Main St Fall River, MA 02724
Father Kelly NeighborhoodEstimated Value: $226,080
2
Beds
3
Baths
2,275
Sq Ft
$99/Sq Ft
Est. Value
About This Home
This home is located at 314 E Main St, Fall River, MA 02724 and is currently estimated at $226,080, approximately $99 per square foot. 314 E Main St is a home located in Bristol County with nearby schools including Carlton M. Viveiros Elementary School, Matthew J. Kuss Middle School, and B M C Durfee High School.
Ownership History
Date
Name
Owned For
Owner Type
Purchase Details
Closed on
Mar 10, 2022
Sold by
Zhang Juanhong
Bought by
Ambition Realty Llc
Current Estimated Value
Home Financials for this Owner
Home Financials are based on the most recent Mortgage that was taken out on this home.
Original Mortgage
$146,000
Outstanding Balance
$135,921
Interest Rate
3.92%
Mortgage Type
Commercial
Estimated Equity
$90,159
Purchase Details
Closed on
Oct 17, 2012
Sold by
Shaker Realty Inc
Bought by
Zhang Junzhong
Purchase Details
Closed on
Oct 25, 2011
Sold by
Rockland Tcomp
Bought by
Shaker Shaker J J
Purchase Details
Closed on
Mar 31, 2010
Sold by
Martin Karen A and Rockland T Co
Bought by
Rockland T Co
Purchase Details
Closed on
Jan 4, 2008
Sold by
Borges Antonio M and Borges Maria F
Bought by
Pavao Isilda and Pavao Paul
Purchase Details
Closed on
Aug 18, 1992
Sold by
Slades Ferry Trust Co
Bought by
Borges Antonio M and Borges Maria F
Purchase Details
Closed on
Jan 8, 1991
Sold by
Sousa Antonio M
Bought by
Slades Ferry Tr Co
Purchase Details
Closed on
Feb 24, 1988
Sold by
Martins John
Bought by
Sousa Antonio M
Create a Home Valuation Report for This Property
The Home Valuation Report is an in-depth analysis detailing your home's value as well as a comparison with similar homes in the area
Home Values in the Area
Average Home Value in this Area
Purchase History
| Date | Buyer | Sale Price | Title Company |
|---|---|---|---|
| Ambition Realty Llc | $188,000 | None Available | |
| Ambition Realty Llc | $188,000 | None Available | |
| Ambition Realty Llc | $188,000 | None Available | |
| Zhang Junzhong | $115,000 | -- | |
| Zhang Junzhong | $115,000 | -- | |
| Shaker Shaker J J | $72,500 | -- | |
| Shaker Shaker J J | $72,500 | -- | |
| Rockland T Co | $180,000 | -- | |
| Rockland T Co | $180,000 | -- | |
| Pavao Isilda | $330,000 | -- | |
| Pavao Isilda | $330,000 | -- | |
| Borges Antonio M | $80,500 | -- | |
| Borges Antonio M | $80,500 | -- | |
| Slades Ferry Tr Co | $70,000 | -- | |
| Slades Ferry Tr Co | $70,000 | -- | |
| Sousa Antonio M | $110,000 | -- |
Source: Public Records
Mortgage History
| Date | Status | Borrower | Loan Amount |
|---|---|---|---|
| Open | Ambition Realty Llc | $146,000 | |
| Closed | Ambition Realty Llc | $146,000 | |
| Previous Owner | Sousa Antonio M | $122,000 |
Source: Public Records
Tax History
| Year | Tax Paid | Tax Assessment Tax Assessment Total Assessment is a certain percentage of the fair market value that is determined by local assessors to be the total taxable value of land and additions on the property. | Land | Improvement |
|---|---|---|---|---|
| 2025 | $4,731 | $210,000 | $98,000 | $112,000 |
| 2024 | $4,731 | $197,600 | $93,400 | $104,200 |
| 2023 | $0 | $242,300 | $82,800 | $159,500 |
| 2022 | $3,058 | $242,300 | $82,800 | $159,500 |
| 2021 | $0 | $220,800 | $80,500 | $140,300 |
| 2020 | $5,261 | $220,000 | $81,900 | $138,100 |
| 2019 | $5,276 | $215,700 | $81,900 | $133,800 |
| 2018 | $0 | $215,300 | $81,900 | $133,400 |
| 2017 | -- | $215,300 | $81,900 | $133,400 |
| 2016 | -- | $215,300 | $81,900 | $133,400 |
| 2015 | -- | $215,300 | $81,900 | $133,400 |
| 2014 | -- | $215,300 | $81,900 | $133,400 |
Source: Public Records
Map
Nearby Homes
- 314 E Main St Unit 2
- 310 E Main St
- 310 E Main St Unit 2
- 310 E Main St Unit 3
- 294 E Main St
- 70 Price Place
- 88 Price Place
- 348 E Main St Unit 1
- 327 E Main St
- 60 Price Place
- 329 E Main St
- 313 E Main St Unit 315
- 313-315 E Main St
- 350 E Main St Unit 2
- 352 E Main St Unit 1
- 111 Price Place Unit 1
- 350 E Main St Unit 3
- 111 Price Place
- 352 E Main St
- 352 E Main St Unit 3
Your Personal Tour Guide
Ask me questions while you tour the home.