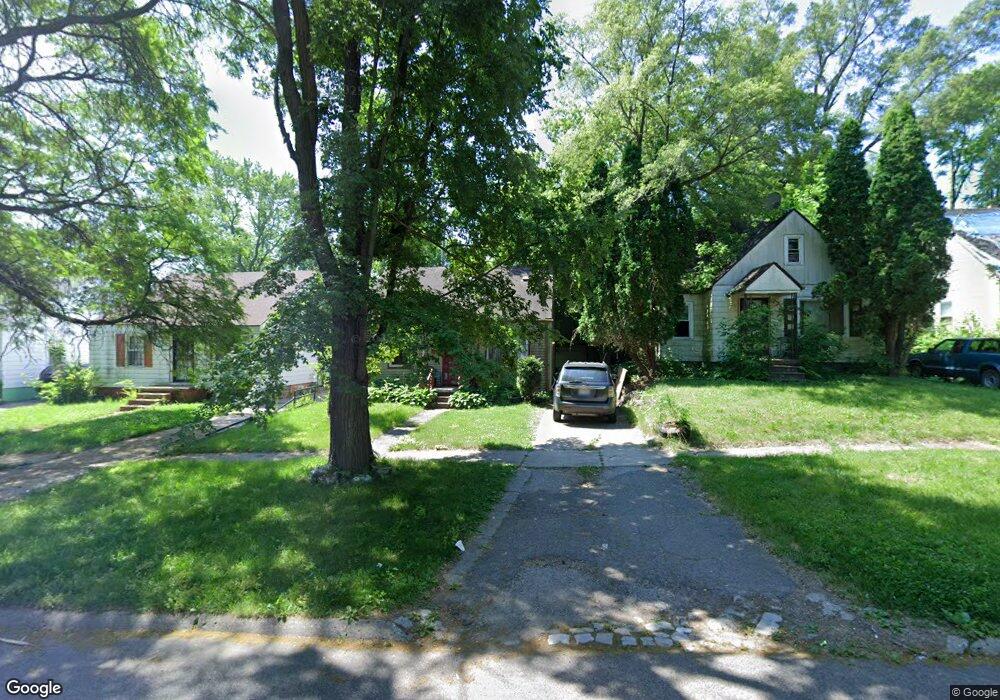
314 E Pulaski Ave Flint, MI 48505
King Avenue Plus NeighborhoodEstimated Value: $31,000 - $44,000
3
Beds
2
Baths
975
Sq Ft
$39/Sq Ft
Est. Value
About This Home
This home is located at 314 E Pulaski Ave, Flint, MI 48505 and is currently estimated at $37,979, approximately $38 per square foot. 314 E Pulaski Ave is a home located in Genesee County with nearby schools including Brownell STEM Academy, The New Standard Academy, and Eagle's Nest Academy.
Ownership History
Date
Name
Owned For
Owner Type
Purchase Details
Closed on
Jan 16, 2014
Sold by
Haywood Floyd
Bought by
Haywood Floyd and Haywood Rosemary
Current Estimated Value
Purchase Details
Closed on
Aug 9, 2005
Sold by
Lamar Ernest D
Bought by
Haywood Floyd
Purchase Details
Closed on
Jun 18, 2004
Sold by
Chase Manhattan Bank Usa Na
Bought by
Wachovia Bank Na
Purchase Details
Closed on
Jun 9, 2004
Sold by
Nelson Harry D and Nelson Joyce E
Bought by
Chase Manhattan Bank Usa Na
Purchase Details
Closed on
Dec 10, 1999
Sold by
Hatcher L Hatcher C and Hatcher Bernie R
Bought by
Nelson Harry D and Nelson Joyce E
Home Financials for this Owner
Home Financials are based on the most recent Mortgage that was taken out on this home.
Original Mortgage
$11,300
Interest Rate
7.87%
Mortgage Type
Purchase Money Mortgage
Purchase Details
Closed on
Jun 16, 1999
Sold by
Debruce Inez
Bought by
Family Equity Inc
Purchase Details
Closed on
Jan 22, 1999
Sold by
Hatcher C L
Bought by
Hatcher Bernie R and Hatcher Cynthia L
Create a Home Valuation Report for This Property
The Home Valuation Report is an in-depth analysis detailing your home's value as well as a comparison with similar homes in the area
Home Values in the Area
Average Home Value in this Area
Purchase History
| Date | Buyer | Sale Price | Title Company |
|---|---|---|---|
| Haywood Floyd | -- | None Available | |
| Haywood Floyd | -- | -- | |
| Wachovia Bank Na | -- | -- | |
| Chase Manhattan Bank Usa Na | $25,000 | -- | |
| Nelson Harry D | $10,000 | Centennial Title & Abstract | |
| Family Equity Inc | $7,202 | -- | |
| Hatcher Bernie R | -- | -- |
Source: Public Records
Mortgage History
| Date | Status | Borrower | Loan Amount |
|---|---|---|---|
| Previous Owner | Nelson Harry D | $11,300 |
Source: Public Records
Tax History
| Year | Tax Paid | Tax Assessment Tax Assessment Total Assessment is a certain percentage of the fair market value that is determined by local assessors to be the total taxable value of land and additions on the property. | Land | Improvement |
|---|---|---|---|---|
| 2025 | $910 | $15,000 | $0 | $0 |
| 2024 | $848 | $13,700 | $0 | $0 |
| 2023 | $833 | $10,600 | $0 | $0 |
| 2022 | $0 | $9,200 | $0 | $0 |
| 2021 | $848 | $9,200 | $0 | $0 |
| 2020 | $785 | $7,900 | $0 | $0 |
| 2019 | $826 | $8,600 | $0 | $0 |
| 2018 | $648 | $9,300 | $0 | $0 |
| 2017 | $632 | $0 | $0 | $0 |
| 2016 | $628 | $0 | $0 | $0 |
| 2015 | -- | $0 | $0 | $0 |
| 2014 | -- | $0 | $0 | $0 |
| 2012 | -- | $10,900 | $0 | $0 |
Source: Public Records
Map
Nearby Homes
- 205 E Baltimore Blvd
- 350 E Mott Ave
- 618 E Parkway Ave
- 680 E Pierson Rd
- 124 W Flint Park Blvd
- 329 W Baltimore Blvd
- 0 E Marengo Ave Unit 50200980
- 525 W Pulaski Ave
- 510 W Bishop Ave
- 225 E Piper Ave
- 702/718 W Flint Park Blvd
- 345 E Austin Ave
- 5416 Dupont St
- 4808 Edwards Ave
- 3810 Marvin St
- 536 W Home Ave
- 421 E Lorado Ave
- 425 E Lorado Ave
- 4028 North St
- 802 E Russell Ave
- 310 E Pulaski Ave
- 318 E Pulaski Ave
- 306 E Pulaski Ave
- 322 E Pulaski Ave
- 313 E Marengo Ave
- 305 E Marengo Ave
- 326 E Pulaski Ave
- 302 E Pulaski Ave
- 321 E Marengo Ave
- 301 E Marengo Ave
- 325 E Marengo Ave
- 230 E Pulaski Ave
- 330 E Pulaski Ave
- 313 E Pulaski Ave
- 309 E Pulaski Ave
- 317 E Pulaski Ave
- 229 E Marengo Ave
- 329 E Marengo Ave
- 305 E Pulaski Ave
- 321 E Pulaski Ave
Your Personal Tour Guide
Ask me questions while you tour the home.