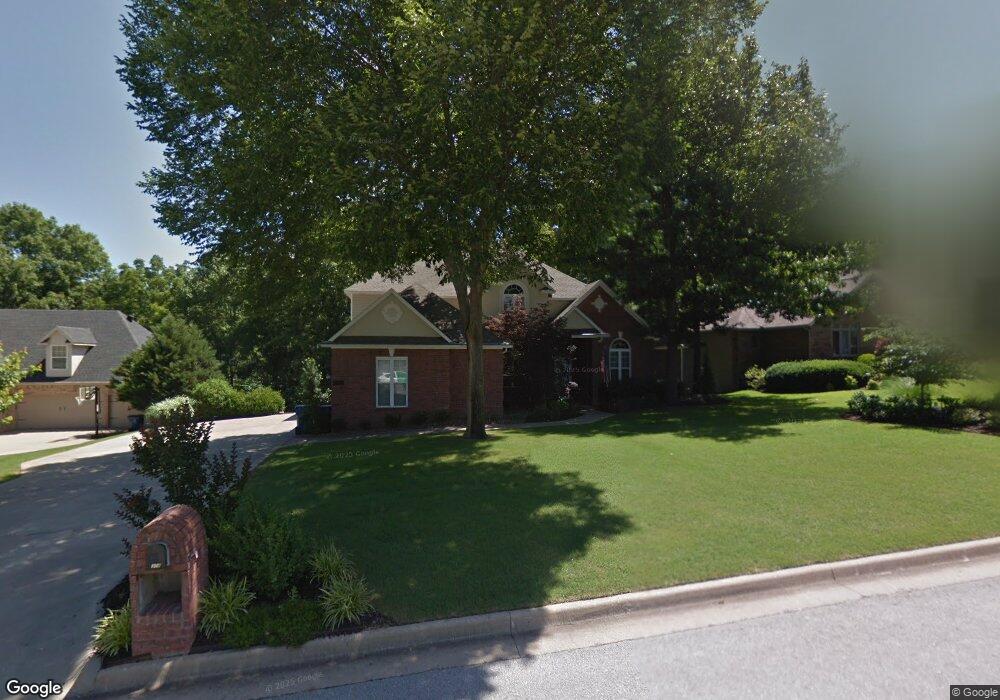
314 Genesis Dr Bentonville, AR 72712
Estimated Value: $710,902 - $872,000
4
Beds
3
Baths
2,831
Sq Ft
$281/Sq Ft
Est. Value
About This Home
This home is located at 314 Genesis Dr, Bentonville, AR 72712 and is currently estimated at $794,476, approximately $280 per square foot. 314 Genesis Dr is a home located in Benton County with nearby schools including Sugar Creek Elementary School, Lincoln Junior High School, and Old High Middle School.
Ownership History
Date
Name
Owned For
Owner Type
Purchase Details
Closed on
Jun 5, 2009
Sold by
Cook Alexander J and Cook Theresa L
Bought by
Christ Kevin J and Christ Cynthia L
Current Estimated Value
Home Financials for this Owner
Home Financials are based on the most recent Mortgage that was taken out on this home.
Original Mortgage
$209,200
Outstanding Balance
$132,106
Interest Rate
4.84%
Mortgage Type
Purchase Money Mortgage
Estimated Equity
$662,370
Purchase Details
Closed on
Mar 26, 2002
Bought by
Cook
Purchase Details
Closed on
Jul 12, 2001
Bought by
Dod 07-12-2001
Purchase Details
Closed on
May 19, 1999
Bought by
Bainbridge
Purchase Details
Closed on
Nov 20, 1998
Bought by
Trudo
Purchase Details
Closed on
Feb 2, 1995
Bought by
Trudo C
Purchase Details
Closed on
Jun 13, 1994
Bought by
Hidden Spr Ent
Purchase Details
Closed on
May 3, 1994
Bought by
N and A
Create a Home Valuation Report for This Property
The Home Valuation Report is an in-depth analysis detailing your home's value as well as a comparison with similar homes in the area
Home Values in the Area
Average Home Value in this Area
Purchase History
| Date | Buyer | Sale Price | Title Company |
|---|---|---|---|
| Christ Kevin J | $314,000 | Trust Title Company | |
| Cook | $270,000 | -- | |
| Dod 07-12-2001 | -- | -- | |
| Bainbridge | $243,000 | -- | |
| Trudo | $30,000 | -- | |
| Trudo C | -- | -- | |
| Hidden Spr Ent | -- | -- | |
| N | -- | -- |
Source: Public Records
Mortgage History
| Date | Status | Borrower | Loan Amount |
|---|---|---|---|
| Open | Christ Kevin J | $209,200 |
Source: Public Records
Tax History Compared to Growth
Tax History
| Year | Tax Paid | Tax Assessment Tax Assessment Total Assessment is a certain percentage of the fair market value that is determined by local assessors to be the total taxable value of land and additions on the property. | Land | Improvement |
|---|---|---|---|---|
| 2025 | $4,644 | $116,434 | $30,000 | $86,434 |
| 2024 | $4,453 | $116,434 | $30,000 | $86,434 |
| 2023 | $4,241 | $74,710 | $8,600 | $66,110 |
| 2022 | $3,781 | $74,710 | $8,600 | $66,110 |
| 2021 | $3,579 | $74,710 | $8,600 | $66,110 |
| 2020 | $3,427 | $59,690 | $7,400 | $52,290 |
| 2019 | $3,427 | $59,690 | $7,400 | $52,290 |
| 2018 | $3,452 | $59,690 | $7,400 | $52,290 |
| 2017 | $3,237 | $59,690 | $7,400 | $52,290 |
| 2016 | $3,237 | $59,690 | $7,400 | $52,290 |
| 2015 | $3,404 | $55,080 | $8,000 | $47,080 |
| 2014 | $3,054 | $55,080 | $8,000 | $47,080 |
Source: Public Records
Map
Nearby Homes
- 0 NW Turner Dr
- 2017 NW Desoto Dr
- 14 Valley View Cir
- 2311 NW Harvard Walk
- 802 NW 20th St
- 203 NW Lasalle Dr
- Lot 3 NW Hidden Cove
- 9 Hanna Dr
- 1703 Kimberly Place
- 1606 Kimberly Place
- 1 Greenridge Ln
- 1605 Kimberly Place
- 1016 NW A St
- 1022 NW A St
- 12502 Slaughter Pen Rd
- 703 NE Heights Ln
- 5 NW Robson Way
- 701 NE Heights Ln
- 1259 NW A St
- 1310 Bella Vista Rd