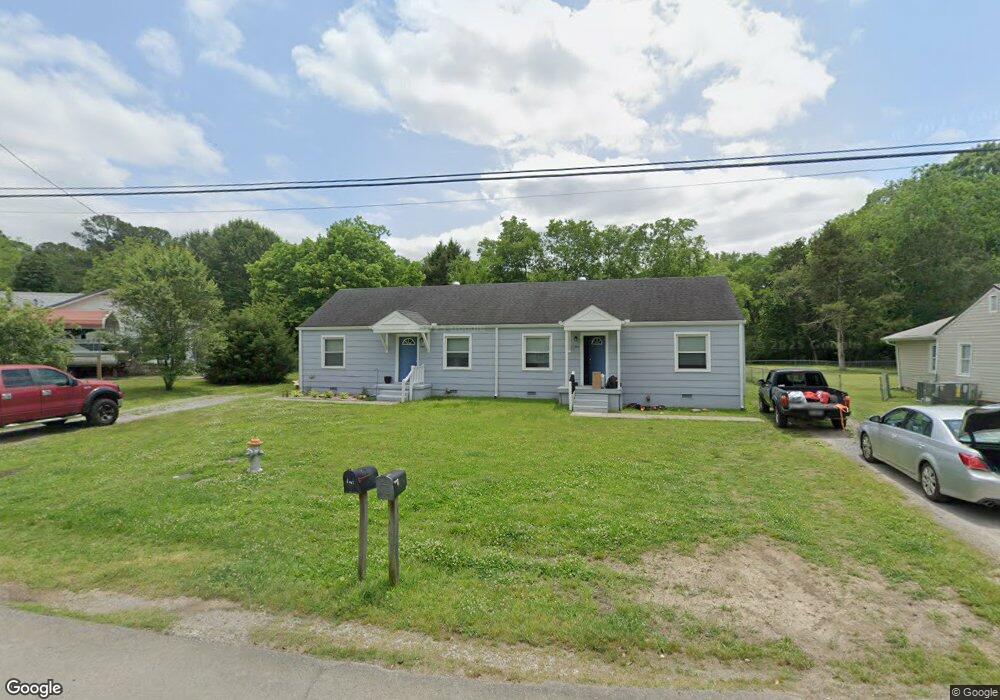
314 Harker Rd Unit A Fort Oglethorpe, GA 30742
Estimated Value: $189,000 - $242,591
Studio
2
Baths
1,584
Sq Ft
$139/Sq Ft
Est. Value
About This Home
This home is located at 314 Harker Rd Unit A, Fort Oglethorpe, GA 30742 and is currently estimated at $220,398, approximately $139 per square foot. 314 Harker Rd Unit A is a home located in Catoosa County with nearby schools including Battlefield Primary School, Battlefield Elementary School, and Lakeview Middle School.
Ownership History
Date
Name
Owned For
Owner Type
Purchase Details
Closed on
Jul 19, 2021
Sold by
Wise Property Solutions Llc
Bought by
Kapusta Caleb and Kapusta Nathan
Current Estimated Value
Home Financials for this Owner
Home Financials are based on the most recent Mortgage that was taken out on this home.
Original Mortgage
$150,000
Outstanding Balance
$134,983
Interest Rate
2.93%
Mortgage Type
New Conventional
Estimated Equity
$85,415
Purchase Details
Closed on
Sep 17, 2020
Sold by
Clarence T Boyle Construction Llc
Bought by
Wise Property Solutions Llc
Home Financials for this Owner
Home Financials are based on the most recent Mortgage that was taken out on this home.
Original Mortgage
$112,616
Interest Rate
2.9%
Mortgage Type
Commercial
Purchase Details
Closed on
Aug 7, 2019
Sold by
Boyle Clarence T
Bought by
Clarence T Boyle Construction
Purchase Details
Closed on
Oct 17, 2003
Bought by
Boyle Clarence T
Create a Home Valuation Report for This Property
The Home Valuation Report is an in-depth analysis detailing your home's value as well as a comparison with similar homes in the area
Home Values in the Area
Average Home Value in this Area
Purchase History
| Date | Buyer | Sale Price | Title Company |
|---|---|---|---|
| Kapusta Caleb | $200,000 | -- | |
| Wise Property Solutions Llc | $130,000 | -- | |
| Clarence T Boyle Construction | -- | -- | |
| Boyle Clarence T | -- | -- |
Source: Public Records
Mortgage History
| Date | Status | Borrower | Loan Amount |
|---|---|---|---|
| Open | Kapusta Caleb | $150,000 | |
| Previous Owner | Wise Property Solutions Llc | $112,616 |
Source: Public Records
Tax History
| Year | Tax Paid | Tax Assessment Tax Assessment Total Assessment is a certain percentage of the fair market value that is determined by local assessors to be the total taxable value of land and additions on the property. | Land | Improvement |
|---|---|---|---|---|
| 2025 | $1,860 | $91,504 | $10,000 | $81,504 |
| 2024 | $2,178 | $85,760 | $8,032 | $77,728 |
| 2023 | $1,378 | $49,052 | $8,032 | $41,020 |
| 2022 | $1,104 | $39,308 | $8,032 | $31,276 |
| 2021 | $987 | $37,074 | $8,032 | $29,042 |
| 2020 | $953 | $32,286 | $8,032 | $24,254 |
| 2019 | $963 | $32,286 | $8,032 | $24,254 |
| 2018 | $867 | $27,656 | $7,140 | $20,516 |
| 2017 | $889 | $28,352 | $7,140 | $21,212 |
| 2016 | $867 | $26,474 | $7,140 | $19,334 |
| 2015 | -- | $26,474 | $7,140 | $19,334 |
| 2014 | -- | $26,474 | $7,140 | $19,334 |
| 2013 | -- | $26,474 | $7,140 | $19,334 |
Source: Public Records
Map
Nearby Homes
Your Personal Tour Guide
Ask me questions while you tour the home.