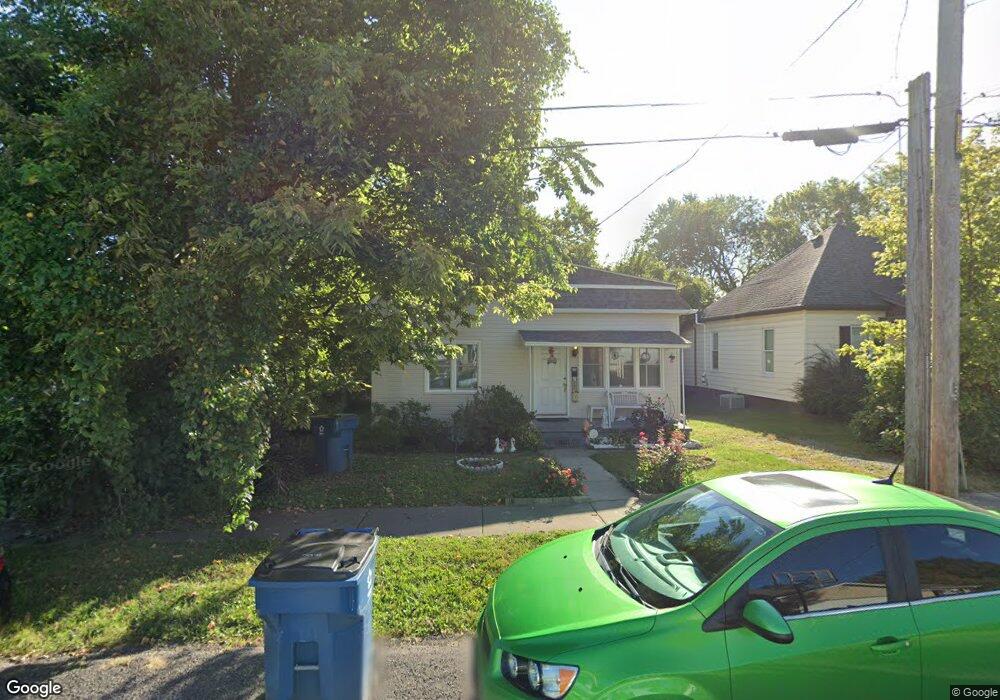
314 Hartman Dr Collinsville, IL 62234
Estimated Value: $126,000 - $202,000
2
Beds
1
Bath
995
Sq Ft
$157/Sq Ft
Est. Value
About This Home
This home is located at 314 Hartman Dr, Collinsville, IL 62234 and is currently estimated at $156,600, approximately $157 per square foot. 314 Hartman Dr is a home located in Madison County with nearby schools including Summit Elementary School, Dorris Intermediate School, and Collinsville Middle School.
Ownership History
Date
Name
Owned For
Owner Type
Purchase Details
Closed on
Jul 6, 2009
Sold by
Us Bank National Association
Bought by
Morgan Michael
Current Estimated Value
Purchase Details
Closed on
Nov 17, 2008
Sold by
Birks Melissa C and Birks Melissa
Bought by
Us Bank National Association
Purchase Details
Closed on
Oct 27, 2004
Sold by
Zamarione Anthony
Bought by
Birks Melissa C
Home Financials for this Owner
Home Financials are based on the most recent Mortgage that was taken out on this home.
Original Mortgage
$79,900
Interest Rate
6.45%
Mortgage Type
Purchase Money Mortgage
Purchase Details
Closed on
Oct 25, 2004
Sold by
Blumberg Judith A and Zamarione Terry W
Bought by
Zamarione Anthony
Home Financials for this Owner
Home Financials are based on the most recent Mortgage that was taken out on this home.
Original Mortgage
$79,900
Interest Rate
6.45%
Mortgage Type
Purchase Money Mortgage
Create a Home Valuation Report for This Property
The Home Valuation Report is an in-depth analysis detailing your home's value as well as a comparison with similar homes in the area
Home Values in the Area
Average Home Value in this Area
Purchase History
| Date | Buyer | Sale Price | Title Company |
|---|---|---|---|
| Morgan Michael | $33,000 | Fatic | |
| Us Bank National Association | -- | None Available | |
| Birks Melissa C | $80,000 | -- | |
| Zamarione Anthony | -- | -- |
Source: Public Records
Mortgage History
| Date | Status | Borrower | Loan Amount |
|---|---|---|---|
| Previous Owner | Birks Melissa C | $79,900 |
Source: Public Records
Tax History Compared to Growth
Tax History
| Year | Tax Paid | Tax Assessment Tax Assessment Total Assessment is a certain percentage of the fair market value that is determined by local assessors to be the total taxable value of land and additions on the property. | Land | Improvement |
|---|---|---|---|---|
| 2024 | $2,585 | $40,440 | $7,200 | $33,240 |
| 2023 | $2,585 | $37,430 | $6,660 | $30,770 |
| 2022 | $2,463 | $33,660 | $5,960 | $27,700 |
| 2021 | $2,184 | $31,620 | $5,600 | $26,020 |
| 2020 | $2,106 | $30,170 | $5,340 | $24,830 |
| 2019 | $2,050 | $29,140 | $5,160 | $23,980 |
| 2018 | $1,905 | $26,250 | $4,870 | $21,380 |
| 2017 | $1,908 | $25,720 | $4,770 | $20,950 |
| 2016 | $2,010 | $25,720 | $4,770 | $20,950 |
| 2015 | $1,876 | $25,060 | $4,650 | $20,410 |
| 2014 | $1,876 | $25,060 | $4,650 | $20,410 |
| 2013 | $1,876 | $25,060 | $4,650 | $20,410 |
Source: Public Records
Map
Nearby Homes
- 205 Audrey Ave
- 300 N Combs Ave
- 221 N Hesperia St Unit 221 A and 221 B
- 108 Westridge Dr
- 0 Elm St
- 119 N Hesperia St
- 126 Collinsville Ave
- 611 W Main St
- 510 N Combs Ave
- 506 W Clay St
- 419 Bell St
- 125 S Hesperia St
- 101 Westminster Dr
- 580 N Guernsey St
- 746 Maple St
- 100 Debbie Dr
- 123 Elliot St
- 121 S Seminary St
- 820 Bond Ave
- 0 Strong Ave
- 312 Hartman Dr
- 316 Hartman Dr
- Lot 71 Hartman Dr
- 318 Hartman Dr
- 915 Powell Ave
- 911 Powell Ave
- 320 Hartman Dr
- 311 Hartman Dr
- 909 Powell Ave
- 313 Hartman Dr
- 1001 Powell Ave
- 317 Hartman Dr
- 324 Hartman Dr
- 905 Powell Ave
- 1003 Powell Ave
- 319 Hartman Dr
- 1005 Powell Ave
- 316 Monroe St
- 316 McAffee Ave
- 314 Monroe St