Estimated Value: $90,000 - $108,000
3
Beds
1
Bath
1,479
Sq Ft
$68/Sq Ft
Est. Value
About This Home
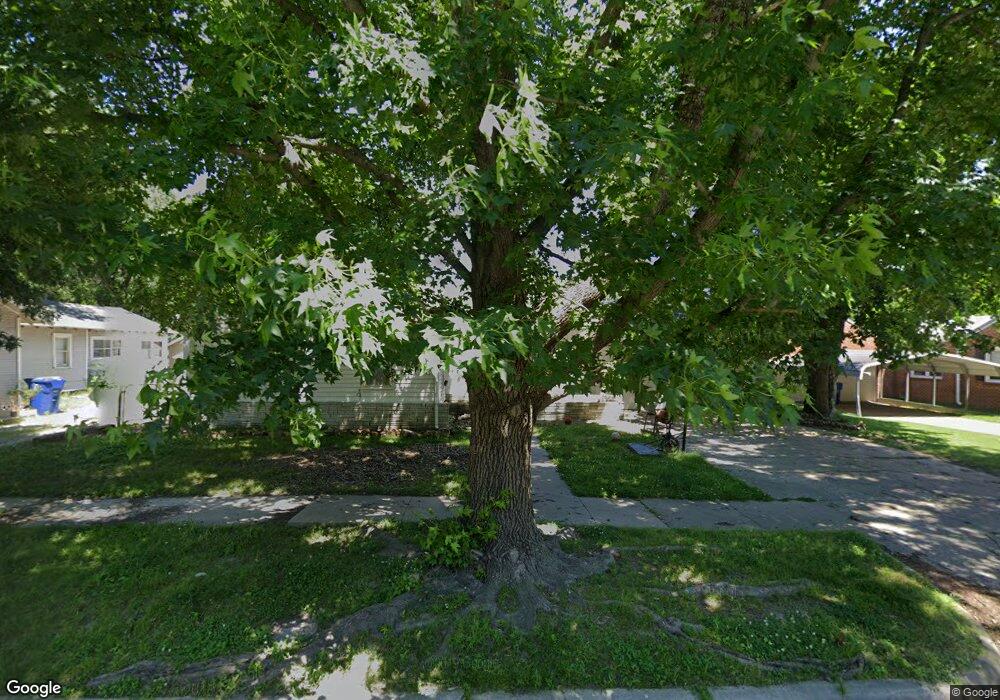
This home is located at 314 J St NW, Miami, OK 74354 and is currently estimated at $100,107, approximately $67 per square foot. 314 J St NW is a home located in Ottawa County with nearby schools including Miami High School and Mt. Olive Lutheran School.
Ownership History
Date
Name
Owned For
Owner Type
Purchase Details
Closed on
Apr 22, 2014
Bought by
Shamblin Arnold Warren
Current Estimated Value
Purchase Details
Closed on
Jan 14, 2014
Bought by
Sec Of Housing & Urban De
Purchase Details
Closed on
Sep 3, 2008
Sold by
Coble Gracie J and Herndon Gracie J
Bought by
Morrison Paul
Home Financials for this Owner
Home Financials are based on the most recent Mortgage that was taken out on this home.
Original Mortgage
$75,007
Interest Rate
6.6%
Mortgage Type
FHA
Create a Home Valuation Report for This Property
The Home Valuation Report is an in-depth analysis detailing your home's value as well as a comparison with similar homes in the area
Home Values in the Area
Average Home Value in this Area
Purchase History
| Date | Buyer | Sale Price | Title Company |
|---|---|---|---|
| Shamblin Arnold Warren | -- | -- | |
| Sec Of Housing & Urban De | -- | -- | |
| Morrison Paul | $76,000 | None Available |
Source: Public Records
Mortgage History
| Date | Status | Borrower | Loan Amount |
|---|---|---|---|
| Previous Owner | Morrison Paul | $75,007 |
Source: Public Records
Tax History Compared to Growth
Tax History
| Year | Tax Paid | Tax Assessment Tax Assessment Total Assessment is a certain percentage of the fair market value that is determined by local assessors to be the total taxable value of land and additions on the property. | Land | Improvement |
|---|---|---|---|---|
| 2025 | $786 | $7,120 | $570 | $6,550 |
| 2024 | $786 | $8,152 | $570 | $7,582 |
| 2023 | $786 | $8,222 | $570 | $7,652 |
| 2022 | $724 | $7,830 | $570 | $7,260 |
| 2021 | $705 | $7,458 | $570 | $6,888 |
| 2020 | $677 | $7,102 | $570 | $6,532 |
| 2019 | $555 | $6,764 | $570 | $6,194 |
| 2018 | $532 | $6,442 | $570 | $5,872 |
| 2017 | $515 | $6,135 | $570 | $5,565 |
| 2016 | $469 | $5,843 | $570 | $5,273 |
| 2015 | $211 | $2,372 | $465 | $1,907 |
| 2014 | $374 | $5,565 | $570 | $4,995 |
Source: Public Records
Map
Nearby Homes