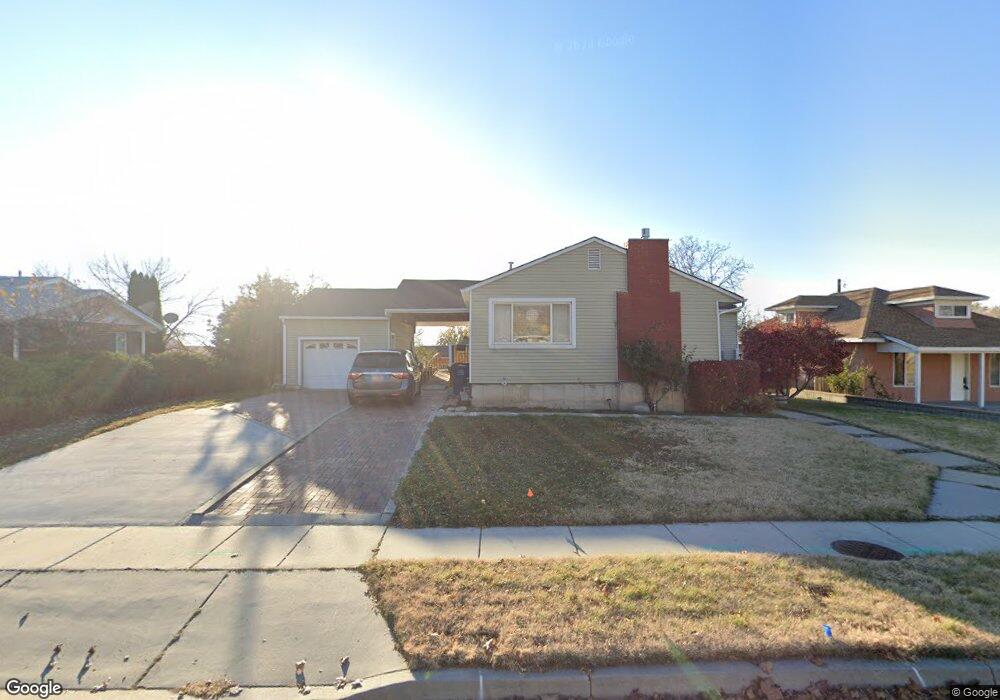
314 Larkin Ln Kaysville, UT 84037
Estimated Value: $470,000 - $569,000
5
Beds
2
Baths
1,312
Sq Ft
$403/Sq Ft
Est. Value
About This Home
This home is located at 314 Larkin Ln, Kaysville, UT 84037 and is currently estimated at $529,324, approximately $403 per square foot. 314 Larkin Ln is a home located in Davis County with nearby schools including Columbia Elementary School, Kaysville Junior High School, and Davis High School.
Ownership History
Date
Name
Owned For
Owner Type
Purchase Details
Closed on
Jul 17, 2024
Sold by
Lafon Simpson Allen Living Trust and Allen Bryce Dale
Bought by
Hofler Michael and Christensen Laura
Current Estimated Value
Home Financials for this Owner
Home Financials are based on the most recent Mortgage that was taken out on this home.
Original Mortgage
$475,000
Outstanding Balance
$468,903
Interest Rate
6.99%
Mortgage Type
New Conventional
Estimated Equity
$60,421
Purchase Details
Closed on
Mar 20, 2023
Sold by
Allen Steven Webster
Bought by
Lafon Simpson Allen Living Trust
Purchase Details
Closed on
Oct 15, 2020
Sold by
Allen Lafon S
Bought by
Allen Lafon Simpson and Lafon Simpson Allen Living Tru
Purchase Details
Closed on
Oct 25, 2010
Sold by
Allen Steven R and Allen Claudia B
Bought by
Cba Properties
Create a Home Valuation Report for This Property
The Home Valuation Report is an in-depth analysis detailing your home's value as well as a comparison with similar homes in the area
Home Values in the Area
Average Home Value in this Area
Purchase History
| Date | Buyer | Sale Price | Title Company |
|---|---|---|---|
| Hofler Michael | -- | First American Title Insurance | |
| Lafon Simpson Allen Living Trust | -- | -- | |
| Allen Lafon Simpson | -- | None Available | |
| Cba Properties | -- | Aspen Title Insurance Agency |
Source: Public Records
Mortgage History
| Date | Status | Borrower | Loan Amount |
|---|---|---|---|
| Open | Hofler Michael | $475,000 |
Source: Public Records
Tax History Compared to Growth
Tax History
| Year | Tax Paid | Tax Assessment Tax Assessment Total Assessment is a certain percentage of the fair market value that is determined by local assessors to be the total taxable value of land and additions on the property. | Land | Improvement |
|---|---|---|---|---|
| 2025 | $2,399 | $264,000 | $165,627 | $98,373 |
| 2024 | $2,399 | $253,000 | $169,270 | $83,730 |
| 2023 | $486 | $445,000 | $293,536 | $151,464 |
| 2022 | $2,420 | $253,550 | $140,924 | $112,626 |
| 2021 | $2,006 | $315,000 | $193,110 | $121,890 |
| 2020 | $1,799 | $275,000 | $138,312 | $136,688 |
| 2019 | $1,778 | $267,000 | $110,100 | $156,900 |
| 2018 | $1,617 | $242,000 | $100,091 | $141,909 |
| 2016 | $1,441 | $113,355 | $34,714 | $78,641 |
| 2015 | $1,368 | $102,190 | $34,714 | $67,476 |
| 2014 | $1,434 | $109,110 | $34,714 | $74,396 |
| 2013 | -- | $95,867 | $27,738 | $68,129 |
Source: Public Records
Map
Nearby Homes
- 300 S Larkin Ln
- 384 Christine Way
- 203 S Larkin Ln
- 203 W 350 S
- 75 S Grandison Ct E Unit 69-R
- 86 S Grandison Ct E Unit 79-R
- 127 S Rock Loft Ridge Dr Unit 57-R
- 159 S Rock Loft Ridge Dr Unit 59-R
- 1346 W Blackbird Ln Unit 3
- 209 N Rock Loft Ridge E Unit 32-R
- 198 S Rock Loft Ridge Dr E Unit 6-R
- 246 N Rock Loft Ridge Dr Unit 36-R
- 167 S Grandison E Unit 74-R
- 109 S Rock Loft Ridge Dr Unit 56-R
- 93 S Rock Loft Ridge Dr Unit 55-R
- 34 S Rock Loft Ridge Dr Unit 85-R
- 52 S Grandison Ct E Unit 83-R
- 190 N Rock Loft Ridge Dr Unit 40-R
- 96 S Rock Loft Ridge Dr Unit 12-R
- 28 N Rock Loft Ridge Dr Unit 46-R
- 314 S Larkin Ln
- 300 Larkin Ln
- 369 Autumn Park Cir
- 284 Larkin Ln Unit 288
- 366 W 350 S
- 381 Autumn Park Cir
- 307 Larkin Ln
- 381 Autumn Park Cir
- 317 Larkin Ln
- 297 Larkin Ln
- 352 W 350 S
- 364 Autumn Park Cir
- 374 W 350 S
- 327 Larkin Ln
- 270 Larkin Ln
- 287 Larkin Ln
- 309 Christine Way
- 337 Christine Way
- 389 Autumn Park Cir
- 338 W 350 S