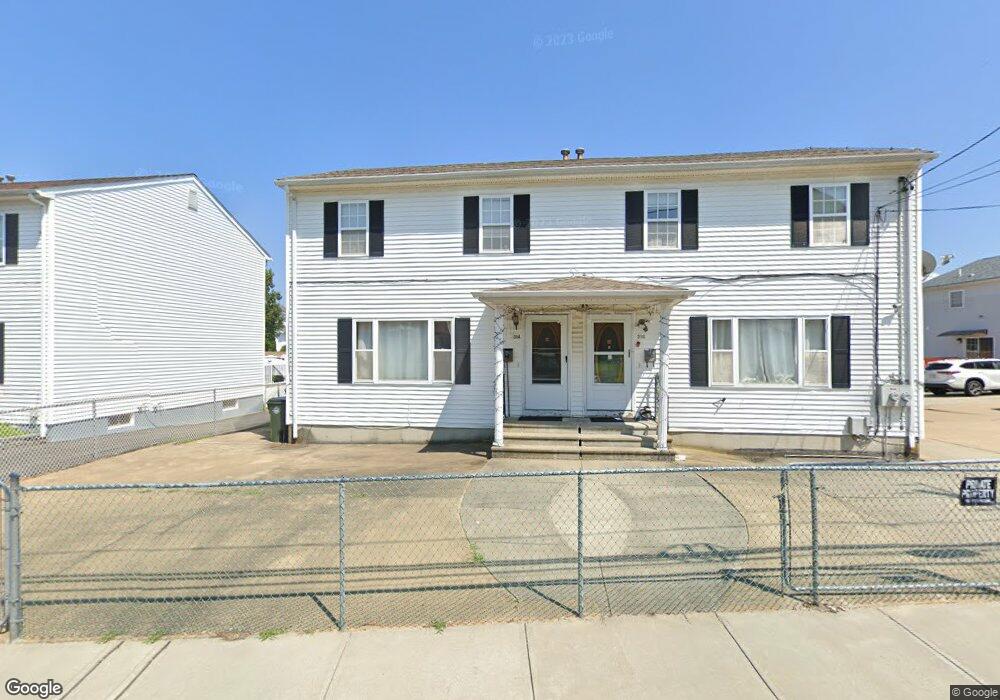
314 Laurel St Unit 316 Fall River, MA 02724
Father Kelly NeighborhoodEstimated Value: $532,914 - $620,000
6
Beds
4
Baths
3,203
Sq Ft
$184/Sq Ft
Est. Value
About This Home
This home is located at 314 Laurel St Unit 316, Fall River, MA 02724 and is currently estimated at $588,229, approximately $183 per square foot. 314 Laurel St Unit 316 is a home located in Bristol County with nearby schools including Henry Lord Community School, B M C Durfee High School, and Argosy Collegiate Charter School.
Ownership History
Date
Name
Owned For
Owner Type
Purchase Details
Closed on
Aug 10, 2018
Sold by
Zhang Jun X and Zhang Ming J
Bought by
Zhang Ming J
Current Estimated Value
Purchase Details
Closed on
Oct 10, 2000
Sold by
Cordeiro Jose M and Cordeiro Maria S
Bought by
Zhang Jun Xiu
Home Financials for this Owner
Home Financials are based on the most recent Mortgage that was taken out on this home.
Original Mortgage
$127,400
Interest Rate
7.96%
Mortgage Type
Purchase Money Mortgage
Purchase Details
Closed on
Feb 17, 1995
Sold by
Gencon Prop Inc
Bought by
Cordeiro Jose M and Cordeiro Maria S
Home Financials for this Owner
Home Financials are based on the most recent Mortgage that was taken out on this home.
Original Mortgage
$139,650
Interest Rate
9.19%
Mortgage Type
Purchase Money Mortgage
Create a Home Valuation Report for This Property
The Home Valuation Report is an in-depth analysis detailing your home's value as well as a comparison with similar homes in the area
Home Values in the Area
Average Home Value in this Area
Purchase History
| Date | Buyer | Sale Price | Title Company |
|---|---|---|---|
| Zhang Ming J | -- | -- | |
| Zhang Jun Xiu | $169,900 | -- | |
| Zhang Jun Xiu | $169,900 | -- | |
| Cordeiro Jose M | $150,000 | -- |
Source: Public Records
Mortgage History
| Date | Status | Borrower | Loan Amount |
|---|---|---|---|
| Previous Owner | Cordeiro Jose M | $127,400 | |
| Previous Owner | Cordeiro Jose M | $139,650 |
Source: Public Records
Tax History
| Year | Tax Paid | Tax Assessment Tax Assessment Total Assessment is a certain percentage of the fair market value that is determined by local assessors to be the total taxable value of land and additions on the property. | Land | Improvement |
|---|---|---|---|---|
| 2025 | $5,525 | $482,500 | $126,200 | $356,300 |
| 2024 | $5,038 | $438,500 | $121,400 | $317,100 |
| 2023 | $4,844 | $394,800 | $104,100 | $290,700 |
| 2022 | $4,431 | $351,100 | $94,600 | $256,500 |
| 2021 | $4,072 | $294,400 | $87,600 | $206,800 |
| 2020 | $3,617 | $250,300 | $83,800 | $166,500 |
| 2019 | $3,403 | $233,400 | $79,800 | $153,600 |
| 2018 | $3,177 | $217,300 | $78,300 | $139,000 |
| 2017 | $2,960 | $211,400 | $79,900 | $131,500 |
| 2016 | $2,883 | $211,500 | $83,200 | $128,300 |
| 2015 | $2,774 | $212,100 | $80,200 | $131,900 |
| 2014 | $2,866 | $227,800 | $84,400 | $143,400 |
Source: Public Records
Map
Nearby Homes
Your Personal Tour Guide
Ask me questions while you tour the home.