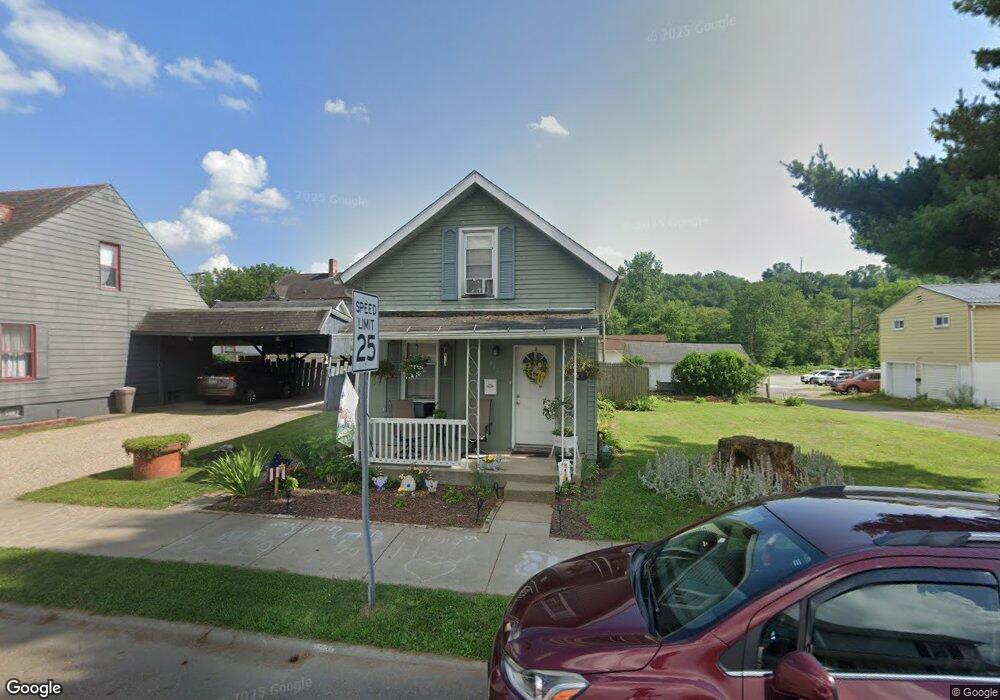
314 Logan St Dennison, OH 44621
Estimated Value: $68,466 - $97,000
2
Beds
1
Bath
1,240
Sq Ft
$66/Sq Ft
Est. Value
About This Home
This home is located at 314 Logan St, Dennison, OH 44621 and is currently estimated at $81,867, approximately $66 per square foot. 314 Logan St is a home located in Tuscarawas County with nearby schools including Claymont High School and Immaculate Conception School.
Ownership History
Date
Name
Owned For
Owner Type
Purchase Details
Closed on
Dec 6, 2012
Sold by
Jarvis Tyler S
Bought by
Buckeye Homestead Ltd
Current Estimated Value
Purchase Details
Closed on
Feb 24, 2006
Sold by
Berni Virginia M
Bought by
Jarvis Tyler S and Jarvis Kara L
Home Financials for this Owner
Home Financials are based on the most recent Mortgage that was taken out on this home.
Original Mortgage
$49,500
Interest Rate
6.2%
Mortgage Type
Fannie Mae Freddie Mac
Purchase Details
Closed on
Nov 3, 2004
Sold by
Estate Of Joseph M Berni
Bought by
Berni Virginia M
Create a Home Valuation Report for This Property
The Home Valuation Report is an in-depth analysis detailing your home's value as well as a comparison with similar homes in the area
Home Values in the Area
Average Home Value in this Area
Purchase History
| Date | Buyer | Sale Price | Title Company |
|---|---|---|---|
| Buckeye Homestead Ltd | $23,801 | None Available | |
| Jarvis Tyler S | $49,500 | None Available | |
| Berni Virginia M | -- | -- |
Source: Public Records
Mortgage History
| Date | Status | Borrower | Loan Amount |
|---|---|---|---|
| Previous Owner | Jarvis Tyler S | $49,500 |
Source: Public Records
Tax History
| Year | Tax Paid | Tax Assessment Tax Assessment Total Assessment is a certain percentage of the fair market value that is determined by local assessors to be the total taxable value of land and additions on the property. | Land | Improvement |
|---|---|---|---|---|
| 2024 | $608 | $46,600 | $8,470 | $38,130 |
| 2023 | $608 | $46,600 | $8,470 | $38,130 |
| 2022 | $613 | $16,310 | $2,965 | $13,346 |
| 2021 | $540 | $13,374 | $1,918 | $11,456 |
| 2020 | $551 | $13,374 | $1,918 | $11,456 |
| 2019 | $529 | $13,374 | $1,918 | $11,456 |
| 2018 | $468 | $11,290 | $1,620 | $9,670 |
| 2017 | $494 | $11,290 | $1,620 | $9,670 |
| 2016 | $492 | $11,290 | $1,620 | $9,670 |
| 2014 | $494 | $11,240 | $1,300 | $9,940 |
| 2013 | $500 | $11,240 | $1,300 | $9,940 |
Source: Public Records
Map
Nearby Homes
Your Personal Tour Guide
Ask me questions while you tour the home.