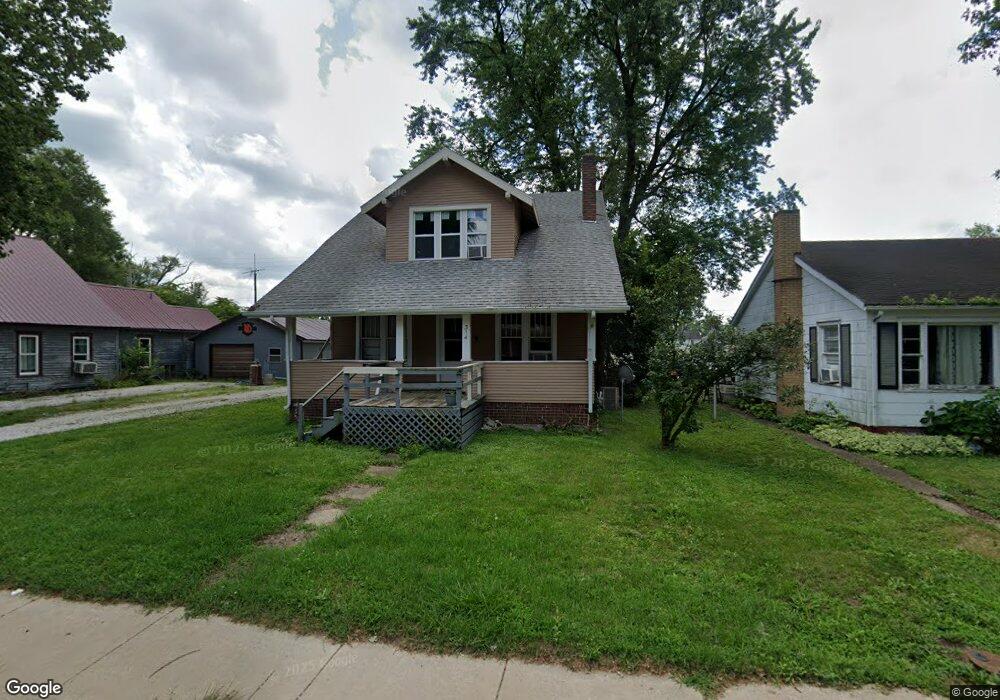
314 Macomb St Colchester, IL 62326
Estimated Value: $59,122 - $83,000
3
Beds
--
Bath
1,078
Sq Ft
$66/Sq Ft
Est. Value
About This Home
This home is located at 314 Macomb St, Colchester, IL 62326 and is currently estimated at $71,531, approximately $66 per square foot. 314 Macomb St is a home located in McDonough County with nearby schools including West Prairie High School.
Ownership History
Date
Name
Owned For
Owner Type
Purchase Details
Closed on
Jul 7, 2025
Sold by
Heap William
Bought by
Bonilla Investments
Current Estimated Value
Purchase Details
Closed on
Jun 11, 2018
Sold by
Lowderman Jack and Lowderman Sharon
Bought by
H & G Construction Inc
Purchase Details
Closed on
Mar 28, 2017
Sold by
First Bankers Trust Company National Ass
Bought by
Lowderman Jack and Lowderman Sharon
Purchase Details
Closed on
Feb 14, 2017
Sold by
Vandermeulen Walton Honorable Patricia Anne
Bought by
First Bankers Trust Co
Purchase Details
Closed on
Jun 30, 2008
Sold by
Swanson Tanna
Bought by
Wilson David and Wilson Julie
Home Financials for this Owner
Home Financials are based on the most recent Mortgage that was taken out on this home.
Original Mortgage
$125,000
Interest Rate
6.1%
Mortgage Type
Commercial
Create a Home Valuation Report for This Property
The Home Valuation Report is an in-depth analysis detailing your home's value as well as a comparison with similar homes in the area
Home Values in the Area
Average Home Value in this Area
Purchase History
| Date | Buyer | Sale Price | Title Company |
|---|---|---|---|
| Bonilla Investments | $44,000 | None Listed On Document | |
| H & G Construction Inc | $15,000 | None Available | |
| Lowderman Jack | $100,000 | None Available | |
| First Bankers Trust Co | -- | None Available | |
| Wilson David | $10,000 | None Available |
Source: Public Records
Mortgage History
| Date | Status | Borrower | Loan Amount |
|---|---|---|---|
| Previous Owner | Wilson David | $125,000 |
Source: Public Records
Tax History Compared to Growth
Tax History
| Year | Tax Paid | Tax Assessment Tax Assessment Total Assessment is a certain percentage of the fair market value that is determined by local assessors to be the total taxable value of land and additions on the property. | Land | Improvement |
|---|---|---|---|---|
| 2024 | $571 | $5,599 | $2,144 | $3,455 |
| 2023 | $546 | $5,298 | $2,029 | $3,269 |
| 2022 | $524 | $5,039 | $1,930 | $3,109 |
| 2021 | $511 | $4,934 | $1,890 | $3,044 |
| 2020 | $500 | $6,709 | $1,858 | $4,851 |
| 2019 | $504 | $4,932 | $1,889 | $3,043 |
| 2018 | $501 | $5,024 | $1,924 | $3,100 |
| 2017 | $1,805 | $17,885 | $2,037 | $15,848 |
| 2016 | $1,771 | $17,534 | $1,997 | $15,537 |
| 2015 | $1,759 | $17,243 | $1,964 | $15,279 |
| 2014 | $1,581 | $16,985 | $1,935 | $15,050 |
| 2013 | $1,539 | $16,023 | $1,825 | $14,198 |
Source: Public Records
Map
Nearby Homes