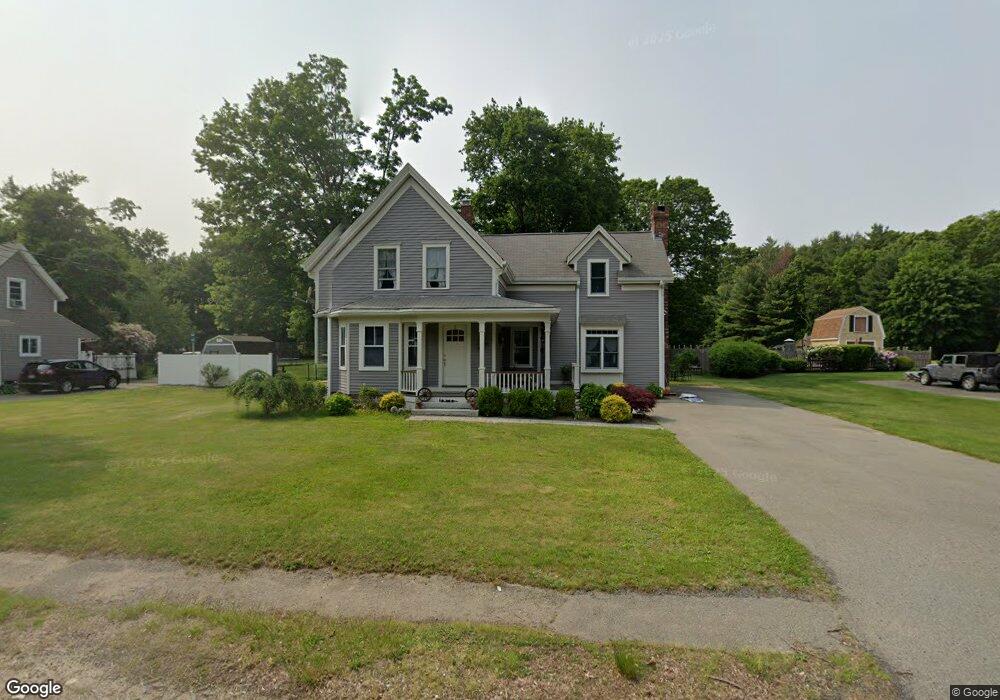
314 Matfield St West Bridgewater, MA 02379
Estimated Value: $622,622 - $681,000
4
Beds
3
Baths
2,180
Sq Ft
$297/Sq Ft
Est. Value
About This Home
This home is located at 314 Matfield St, West Bridgewater, MA 02379 and is currently estimated at $647,656, approximately $297 per square foot. 314 Matfield St is a home located in Plymouth County with nearby schools including Spring Street Elementary School, Howard Elementary School, and Rose L. MacDonald Elementary School.
Ownership History
Date
Name
Owned For
Owner Type
Purchase Details
Closed on
Mar 15, 1993
Sold by
Hanson Peter L and Hanson Gail L
Bought by
Taccini Cynthia A and Taccini Daniel W
Current Estimated Value
Home Financials for this Owner
Home Financials are based on the most recent Mortgage that was taken out on this home.
Original Mortgage
$85,000
Interest Rate
7.8%
Mortgage Type
Purchase Money Mortgage
Create a Home Valuation Report for This Property
The Home Valuation Report is an in-depth analysis detailing your home's value as well as a comparison with similar homes in the area
Home Values in the Area
Average Home Value in this Area
Purchase History
| Date | Buyer | Sale Price | Title Company |
|---|---|---|---|
| Taccini Cynthia A | $134,800 | -- |
Source: Public Records
Mortgage History
| Date | Status | Borrower | Loan Amount |
|---|---|---|---|
| Open | Taccini Cynthia A | $164,000 | |
| Closed | Taccini Cynthia A | $166,500 | |
| Closed | Taccini Cynthia A | $85,000 | |
| Previous Owner | Taccini Cynthia A | $85,000 |
Source: Public Records
Tax History Compared to Growth
Tax History
| Year | Tax Paid | Tax Assessment Tax Assessment Total Assessment is a certain percentage of the fair market value that is determined by local assessors to be the total taxable value of land and additions on the property. | Land | Improvement |
|---|---|---|---|---|
| 2025 | $7,093 | $518,900 | $225,100 | $293,800 |
| 2024 | $6,701 | $472,900 | $204,100 | $268,800 |
| 2023 | $6,028 | $392,200 | $176,700 | $215,500 |
| 2022 | $5,554 | $342,400 | $166,200 | $176,200 |
| 2021 | $5,536 | $331,300 | $166,200 | $165,100 |
| 2020 | $5,423 | $331,300 | $166,200 | $165,100 |
| 2019 | $5,476 | $331,300 | $166,200 | $165,100 |
| 2018 | $5,204 | $313,100 | $157,800 | $155,300 |
| 2017 | $5,143 | $290,100 | $143,100 | $147,000 |
| 2016 | $5,040 | $280,000 | $133,000 | $147,000 |
| 2015 | $5,031 | $282,500 | $133,000 | $149,500 |
| 2014 | $4,601 | $279,000 | $133,000 | $146,000 |
Source: Public Records
Map
Nearby Homes
- 308 Matfield St
- 322 Matfield St
- 311 Matfield St
- 326 Matfield St
- 304 Matfield St
- 305 Matfield St
- 323 Matfield St
- 332 Matfield St
- 298 Matfield St
- 327 Matfield St
- 301 Matfield St
- 295 Matfield St
- 27 Cyr St
- 333 Matfield St
- 294 Matfield St
- 289 Matfield St
- 26 Cyr St
- 345 Matfield St
- 32 Cyr St
- 283 Matfield St