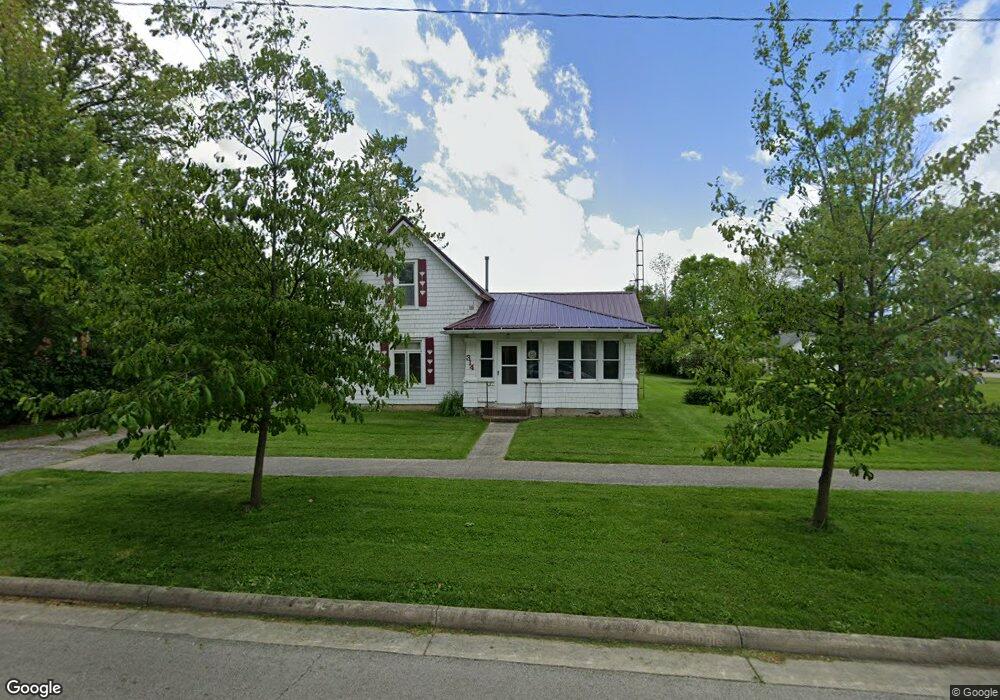
314 N Cherry St Paulding, OH 45879
Estimated Value: $91,061 - $121,000
3
Beds
1
Bath
1,240
Sq Ft
$83/Sq Ft
Est. Value
About This Home
This home is located at 314 N Cherry St, Paulding, OH 45879 and is currently estimated at $103,020, approximately $83 per square foot. 314 N Cherry St is a home located in Paulding County with nearby schools including Paulding High School.
Ownership History
Date
Name
Owned For
Owner Type
Purchase Details
Closed on
Mar 20, 2013
Sold by
Bakle Rhonda L and Bakle Rhonda L
Bought by
Livi Bakle Timothy R and Livi Timothy R Bakle Revocable
Current Estimated Value
Purchase Details
Closed on
Jun 2, 2010
Sold by
Bakle Timothy R and Bakle Rhonda L
Bought by
Livi Bakle Timothy R and Livi Timothy R Bakle Revocable
Purchase Details
Closed on
Jan 10, 2008
Sold by
Rekeweg Ruth E and Thomas Barbara A
Bought by
Bakle Timothy R and Bakle Rhonda L
Home Financials for this Owner
Home Financials are based on the most recent Mortgage that was taken out on this home.
Original Mortgage
$28,000
Interest Rate
6.22%
Mortgage Type
New Conventional
Purchase Details
Closed on
Nov 7, 2003
Sold by
Rekeweg Ruth
Bought by
Bakle Timothy R Trustee
Purchase Details
Closed on
Sep 30, 1993
Bought by
Bakle Timothy R Trustee
Create a Home Valuation Report for This Property
The Home Valuation Report is an in-depth analysis detailing your home's value as well as a comparison with similar homes in the area
Home Values in the Area
Average Home Value in this Area
Purchase History
| Date | Buyer | Sale Price | Title Company |
|---|---|---|---|
| Livi Bakle Timothy R | -- | None Available | |
| Livi Bakle Timothy R | -- | None Available | |
| Bakle Timothy R | $35,000 | None Available | |
| Bakle Timothy R Trustee | -- | -- | |
| Bakle Timothy R Trustee | $32,000 | -- |
Source: Public Records
Mortgage History
| Date | Status | Borrower | Loan Amount |
|---|---|---|---|
| Closed | Bakle Timothy R | $28,000 |
Source: Public Records
Tax History
| Year | Tax Paid | Tax Assessment Tax Assessment Total Assessment is a certain percentage of the fair market value that is determined by local assessors to be the total taxable value of land and additions on the property. | Land | Improvement |
|---|---|---|---|---|
| 2025 | $1,176 | $26,640 | $5,990 | $20,650 |
| 2024 | $1,176 | $21,670 | $4,870 | $16,800 |
| 2023 | $993 | $21,670 | $4,870 | $16,800 |
| 2022 | $965 | $21,670 | $4,870 | $16,800 |
| 2021 | $879 | $16,420 | $4,380 | $12,040 |
| 2020 | $797 | $16,420 | $4,380 | $12,040 |
| 2019 | $805 | $15,340 | $4,380 | $10,960 |
| 2018 | $770 | $15,340 | $4,380 | $10,960 |
| 2017 | $772 | $15,340 | $4,380 | $10,960 |
| 2016 | $774 | $15,340 | $4,380 | $10,960 |
| 2015 | $792 | $15,760 | $4,380 | $11,380 |
| 2014 | $781 | $15,760 | $4,380 | $11,380 |
| 2013 | $885 | $16,350 | $4,380 | $11,970 |
Source: Public Records
Map
Nearby Homes
- 402 N Williams St
- 516 N Williams St
- 308 N Main St
- 301 N Main St
- 726 N Main St
- 508 W Jackson St
- 215 N Dewitt St
- 614 W Jackson St
- 520 W Wayne St
- 829 Greenbriar Ave
- 717 W Harrison St
- 714 W Wayne St
- 701 E Wayne St
- 741 Tom Tim Dr
- 830 N Walnut St
- 742 E Perry St
- 1065 Emerald Rd
- 13688 Kay St
- 11051 Road 93
- 225 2nd St
- 320 N Cherry St
- 219 W Jefferson St
- 313 N Cherry St
- 302 N Cherry St
- 302 N Cherry St
- 402 N Cherry St
- 321 N Cherry St
- 214 W Jefferson St
- 220 W Caroline St
- 220 W Jefferson St
- 401 N Cherry St
- 220 N Cherry St
- 209 W Caroline St
- 403 N Cherry St
- 221 W Caroline St
- 121 W Caroline St
- 121 W Caroline St
- 409 N Cherry St
- 414 N Cherry St
- 316 N Williams St
Your Personal Tour Guide
Ask me questions while you tour the home.