Estimated Value: $111,904 - $165,000
--
Bed
--
Bath
936
Sq Ft
$151/Sq Ft
Est. Value
About This Home
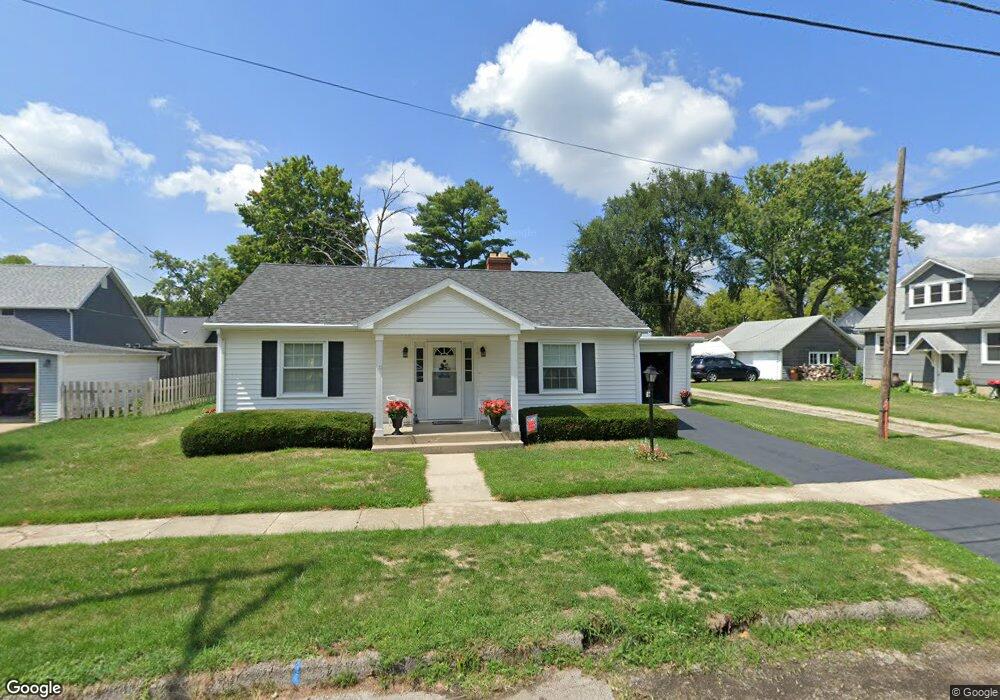
This home is located at 314 N Franklin St, Byron, IL 61010 and is currently estimated at $141,726, approximately $151 per square foot. 314 N Franklin St is a home located in Ogle County with nearby schools including Mary Morgan Elementary School, Byron Middle School, and Byron High School.
Create a Home Valuation Report for This Property
The Home Valuation Report is an in-depth analysis detailing your home's value as well as a comparison with similar homes in the area
Home Values in the Area
Average Home Value in this Area
Tax History Compared to Growth
Tax History
| Year | Tax Paid | Tax Assessment Tax Assessment Total Assessment is a certain percentage of the fair market value that is determined by local assessors to be the total taxable value of land and additions on the property. | Land | Improvement |
|---|---|---|---|---|
| 2024 | $2,241 | $36,997 | $4,451 | $32,546 |
| 2023 | $2,038 | $35,171 | $4,231 | $30,940 |
| 2022 | $1,854 | $32,617 | $3,924 | $28,693 |
| 2021 | $1,786 | $31,224 | $3,756 | $27,468 |
| 2020 | $1,629 | $30,611 | $3,682 | $26,929 |
| 2019 | $1,605 | $29,647 | $3,566 | $26,081 |
| 2018 | $1,581 | $28,882 | $3,474 | $25,408 |
| 2017 | $1,564 | $28,882 | $3,474 | $25,408 |
| 2016 | $1,454 | $28,352 | $3,410 | $24,942 |
| 2015 | $1,356 | $27,446 | $3,301 | $24,145 |
| 2014 | $1,350 | $27,446 | $3,301 | $24,145 |
| 2013 | $1,504 | $27,799 | $3,343 | $24,456 |
Source: Public Records
Map
Nearby Homes
- 401 W 3rd St
- 503 W 2nd St
- 423 W 4th St
- 8890 Hales Corner Rd Rd
- 521 N Walnut St
- 429 N Union St
- 309 Creekside Dr
- 265 Creekside Dr
- 00 E Ashelford Dr Unit LOT 8
- 00 E Ashelford Dr
- 1269 E Kysor Rd
- 815 Hampton Dr
- 4934 E Ashelford Dr
- 1245 Glacier Dr
- 1257 Glacier Dr
- 8692 Glacier Dr
- 1368 Joanne Terrace
- 5166 E Hubbard Trail
- 5304 E Hubbard Trail
- 0 N Kishwaukee Rd Lot Unit WP001
- 407 W 3rd St
- 322 N Franklin St
- 401 W 3rd St Unit 1
- 417 W 3rd St
- 321 W 3rd St
- 421 W 3rd St
- 412 W 4th St
- 328 W 4th St
- 325 N Lafayette St
- 313 W 3rd St
- 313 N Lafayette St
- 416 W 4th St
- 427 W 3rd St
- 316 W 4th St
- 326 N Lafayette St
- 307 W 3rd St
- 226 N Franklin St
- 320 W 3rd St
- 322 N Washington St
- 416 W 3rd St