Estimated Value: $229,000 - $356,427
2
Beds
1
Bath
700
Sq Ft
$442/Sq Ft
Est. Value
About This Home
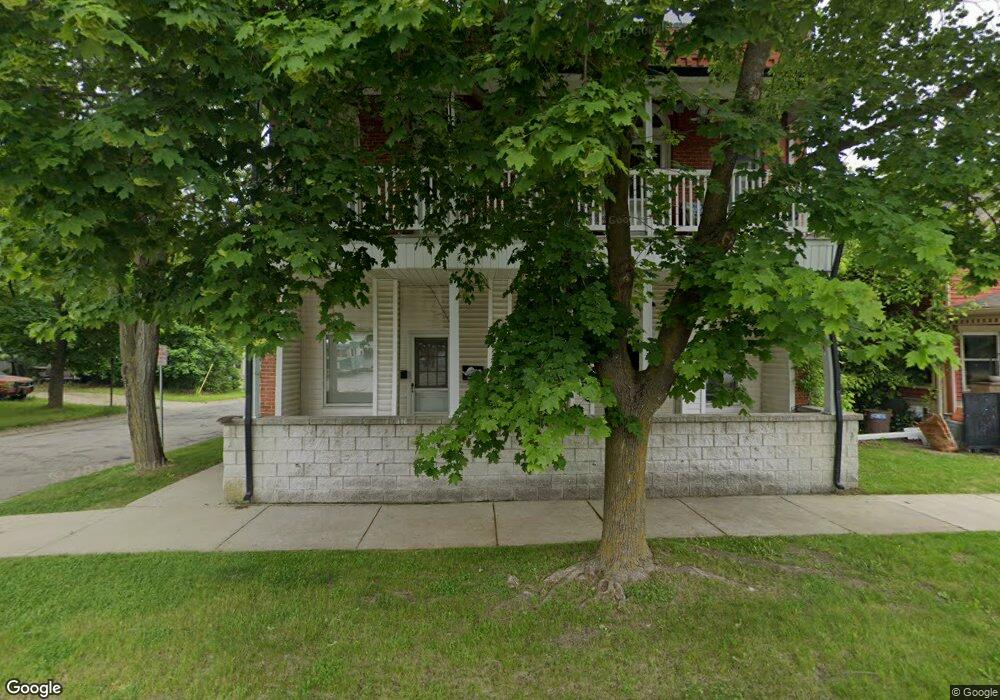
This home is located at 314 S Broad St, Holly, MI 48442 and is currently estimated at $309,357, approximately $441 per square foot. 314 S Broad St is a home located in Oakland County with nearby schools including Holly High School, Holly Academy, and Adelphian Junior Academy.
Ownership History
Date
Name
Owned For
Owner Type
Purchase Details
Closed on
Mar 22, 2018
Sold by
S Broad Llc
Bought by
Zemens Brothers Homes Llc
Current Estimated Value
Purchase Details
Closed on
Aug 31, 2015
Sold by
314 & 316 South Broad Llc
Bought by
The Jeffrey & Katherine Weaver Joint Rev
Home Financials for this Owner
Home Financials are based on the most recent Mortgage that was taken out on this home.
Original Mortgage
$460,000
Interest Rate
3.9%
Mortgage Type
Commercial
Purchase Details
Closed on
Nov 21, 2002
Sold by
J S W Property Four
Bought by
Weaver Jeffrey S
Purchase Details
Closed on
Sep 11, 2000
Sold by
Weaver Jeffrey S
Bought by
J S W Property Four
Purchase Details
Closed on
May 25, 2000
Sold by
Lozuaway F D
Bought by
Weaver Jeffrey
Home Financials for this Owner
Home Financials are based on the most recent Mortgage that was taken out on this home.
Original Mortgage
$116,000
Interest Rate
8.14%
Mortgage Type
Commercial
Create a Home Valuation Report for This Property
The Home Valuation Report is an in-depth analysis detailing your home's value as well as a comparison with similar homes in the area
Home Values in the Area
Average Home Value in this Area
Purchase History
| Date | Buyer | Sale Price | Title Company |
|---|---|---|---|
| Zemens Brothers Homes Llc | $220,000 | Visionary Title Agency Llc | |
| The Jeffrey & Katherine Weaver Joint Rev | -- | None Available | |
| Weaver Jeffrey S | -- | -- | |
| J S W Property Four | -- | -- | |
| Weaver Jeffrey | $144,175 | -- |
Source: Public Records
Mortgage History
| Date | Status | Borrower | Loan Amount |
|---|---|---|---|
| Previous Owner | The Jeffrey & Katherine Weaver Joint Rev | $460,000 | |
| Previous Owner | Weaver Jeffrey | $116,000 |
Source: Public Records
Tax History Compared to Growth
Tax History
| Year | Tax Paid | Tax Assessment Tax Assessment Total Assessment is a certain percentage of the fair market value that is determined by local assessors to be the total taxable value of land and additions on the property. | Land | Improvement |
|---|---|---|---|---|
| 2024 | $5,712 | $147,020 | $0 | $0 |
| 2023 | $5,522 | $132,620 | $0 | $0 |
| 2022 | $5,578 | $118,890 | $0 | $0 |
| 2021 | $5,329 | $107,390 | $0 | $0 |
| 2020 | $4,984 | $97,170 | $0 | $0 |
| 2019 | $3,927 | $87,530 | $0 | $0 |
| 2018 | $4,709 | $88,490 | $0 | $0 |
| 2017 | $5,179 | $86,080 | $0 | $0 |
| 2016 | $5,161 | $76,050 | $0 | $0 |
| 2015 | -- | $65,610 | $0 | $0 |
| 2014 | -- | $57,990 | $0 | $0 |
Source: Public Records
Map
Nearby Homes
- 103 Michigan St
- 100 Oakland St
- 108 College St
- 305 Center St
- 307 Center St
- 810 Canyon Creek Dr Unit 17
- 135 Park Ave
- 205 Park Ave
- 868 Deer Run Lake Rd Unit 87
- 428 Harden St
- 108 Bevins St
- 701 Hartner Dr
- 3443 S Fenton Rd
- 419 Otter Run Rd
- 106 Lakeview St
- 809 Richard St
- 205 Lakeview St
- 810 Holly Bush Ct
- 109 Oakwood St
- 107 Oakwood St
- 310 S Broad St
- 404 S Broad St
- 406 S Broad St
- 304 S Broad St
- 305 S Saginaw St
- 401 S Saginaw St
- 316 S Broad St
- 408 S Broad St
- 303 S Saginaw St
- 403 S Saginaw St
- 410 S Broad St
- 0 S Saginaw St Unit 218065184
- 0 S Saginaw St Unit 218015319
- 0 S Saginaw St Unit 5637541
- 0 S Saginaw St Unit 217072408
- S Saginaw St
- 0 S Saginaw St Unit 4969556
- 0 S Saginaw St Unit 4970431
- 0 S Saginaw St Unit 4965347
- 0 S Saginaw St Unit 4955600