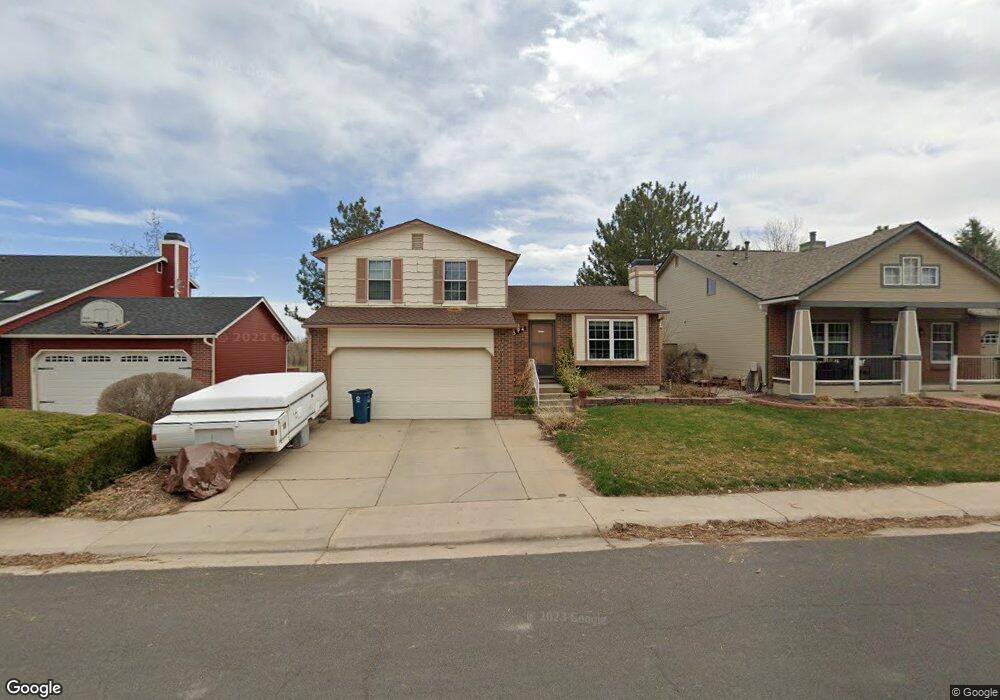
314 S Jefferson Ave Louisville, CO 80027
Estimated Value: $681,153 - $718,000
3
Beds
1
Bath
1,192
Sq Ft
$585/Sq Ft
Est. Value
About This Home
This home is located at 314 S Jefferson Ave, Louisville, CO 80027 and is currently estimated at $696,788, approximately $584 per square foot. 314 S Jefferson Ave is a home located in Boulder County with nearby schools including Louisville Elementary School, Louisville Middle School, and Monarch High School.
Ownership History
Date
Name
Owned For
Owner Type
Purchase Details
Closed on
Nov 26, 2008
Sold by
Miller Joseph F and Lefebvre Francine
Bought by
Melgaard Andrew A
Current Estimated Value
Home Financials for this Owner
Home Financials are based on the most recent Mortgage that was taken out on this home.
Original Mortgage
$229,600
Outstanding Balance
$154,424
Interest Rate
6.5%
Mortgage Type
Purchase Money Mortgage
Estimated Equity
$542,364
Purchase Details
Closed on
Jul 31, 1997
Sold by
Larson Lynden Lee
Bought by
Miller Joseph F
Home Financials for this Owner
Home Financials are based on the most recent Mortgage that was taken out on this home.
Original Mortgage
$108,800
Interest Rate
5.25%
Purchase Details
Closed on
Aug 2, 1989
Bought by
Melgaard Andrew A
Purchase Details
Closed on
Mar 23, 1987
Bought by
Melgaard Andrew A
Purchase Details
Closed on
Jan 15, 1985
Bought by
Melgaard Andrew A
Create a Home Valuation Report for This Property
The Home Valuation Report is an in-depth analysis detailing your home's value as well as a comparison with similar homes in the area
Home Values in the Area
Average Home Value in this Area
Purchase History
| Date | Buyer | Sale Price | Title Company |
|---|---|---|---|
| Melgaard Andrew A | $287,000 | First Colorado Title | |
| Miller Joseph F | $136,000 | -- | |
| Melgaard Andrew A | $83,200 | -- | |
| Melgaard Andrew A | -- | -- | |
| Melgaard Andrew A | $81,300 | -- |
Source: Public Records
Mortgage History
| Date | Status | Borrower | Loan Amount |
|---|---|---|---|
| Open | Melgaard Andrew A | $229,600 | |
| Previous Owner | Miller Joseph F | $108,800 |
Source: Public Records
Tax History Compared to Growth
Tax History
| Year | Tax Paid | Tax Assessment Tax Assessment Total Assessment is a certain percentage of the fair market value that is determined by local assessors to be the total taxable value of land and additions on the property. | Land | Improvement |
|---|---|---|---|---|
| 2025 | $3,579 | $40,881 | $17,075 | $23,806 |
| 2024 | $3,579 | $40,881 | $17,075 | $23,806 |
| 2023 | $3,518 | $39,818 | $18,070 | $25,433 |
| 2022 | $3,025 | $31,435 | $13,261 | $18,174 |
| 2021 | $3,221 | $34,778 | $14,672 | $20,106 |
| 2020 | $2,996 | $32,018 | $13,800 | $18,218 |
| 2019 | $2,954 | $32,018 | $13,800 | $18,218 |
| 2018 | $2,608 | $29,196 | $7,920 | $21,276 |
| 2017 | $2,556 | $32,278 | $8,756 | $23,522 |
| 2016 | $2,224 | $25,273 | $9,393 | $15,880 |
| 2015 | $2,107 | $22,177 | $12,179 | $9,998 |
| 2014 | $1,896 | $22,177 | $12,179 | $9,998 |
Source: Public Records
Map
Nearby Homes
- 298 S Hoover Ave
- 111 Barbara St
- 503 Lois Dr
- 196 Lincoln Cir
- 203 Springs Dr
- 516 Grant Ave
- 242 Clementina St
- 380 County Rd
- TBD L12 County Rd 255
- TBD L14 County Rd 255
- TBD L2 County Rd 255
- TBD L8 County Rd 255
- 291 W Sycamore Ln
- 529 Main St
- 549 Parbois Ln
- 385 East St
- 415 East St
- 625 Lombardi Cir
- 532 Lombardi Cir
- 572 Lombardi Cir
- 310 S Jefferson Ave
- 318 S Jefferson Ave
- 304 S Jefferson Ave
- 323 S Jefferson Ave
- 322 S Jefferson Ave
- 329 S Jefferson Ave
- 596 Juniper Ct
- 294 S Jefferson Ave
- 335 S Jefferson Ave
- 584 Juniper Ct
- 328 S Jefferson Ave
- 280 S Jefferson Ave
- 347 S Jefferson Ave
- 342 S Jefferson Ave
- 493 Lilac Ct
- 330 S Jefferson Ave
- 289 S Jefferson Ave
- 566 Juniper Ct
- 276 S Jefferson Ave
- 457 Lilac Ct