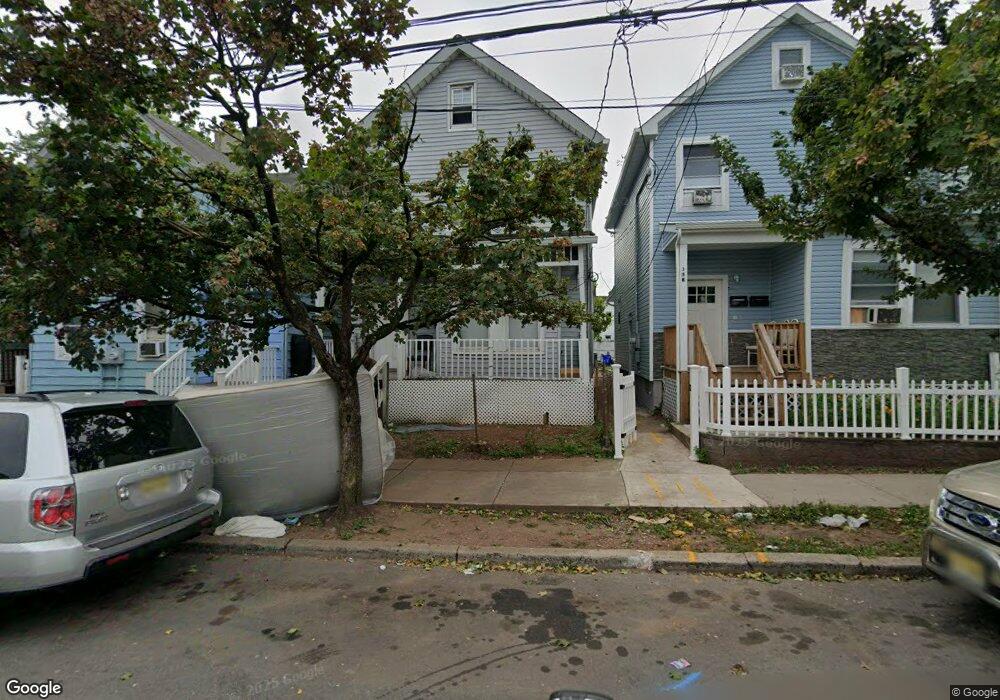
314 Seaman St New Brunswick, NJ 08901
Estimated Value: $388,478 - $447,000
--
Bed
--
Bath
1,763
Sq Ft
$240/Sq Ft
Est. Value
About This Home
This home is located at 314 Seaman St, New Brunswick, NJ 08901 and is currently estimated at $423,370, approximately $240 per square foot. 314 Seaman St is a home located in Middlesex County with nearby schools including New Brunswick High School and Central Jersey College Prep Charter School.
Ownership History
Date
Name
Owned For
Owner Type
Purchase Details
Closed on
Apr 3, 2006
Current Estimated Value
Purchase Details
Closed on
Nov 22, 1993
Sold by
Dev Dabas
Bought by
Beltran Fernando
Home Financials for this Owner
Home Financials are based on the most recent Mortgage that was taken out on this home.
Original Mortgage
$84,000
Interest Rate
6.69%
Create a Home Valuation Report for This Property
The Home Valuation Report is an in-depth analysis detailing your home's value as well as a comparison with similar homes in the area
Home Values in the Area
Average Home Value in this Area
Purchase History
| Date | Buyer | Sale Price | Title Company |
|---|---|---|---|
| -- | -- | -- | |
| Beltran Fernando | $121,000 | -- |
Source: Public Records
Mortgage History
| Date | Status | Borrower | Loan Amount |
|---|---|---|---|
| Previous Owner | Beltran Fernando | $84,000 |
Source: Public Records
Tax History Compared to Growth
Tax History
| Year | Tax Paid | Tax Assessment Tax Assessment Total Assessment is a certain percentage of the fair market value that is determined by local assessors to be the total taxable value of land and additions on the property. | Land | Improvement |
|---|---|---|---|---|
| 2025 | $4,570 | $174,500 | $75,000 | $99,500 |
| 2024 | $4,438 | $174,500 | $75,000 | $99,500 |
| 2023 | $4,438 | $174,500 | $75,000 | $99,500 |
| 2022 | $4,343 | $174,500 | $75,000 | $99,500 |
| 2021 | $3,222 | $174,500 | $75,000 | $99,500 |
| 2020 | $4,310 | $174,500 | $75,000 | $99,500 |
| 2019 | $4,228 | $174,500 | $75,000 | $99,500 |
| 2018 | $4,132 | $174,500 | $75,000 | $99,500 |
| 2017 | $3,968 | $174,500 | $75,000 | $99,500 |
| 2016 | $4,575 | $78,000 | $22,500 | $55,500 |
| 2015 | $4,466 | $78,000 | $22,500 | $55,500 |
| 2014 | $5,213 | $92,700 | $22,500 | $70,200 |
Source: Public Records
Map
Nearby Homes