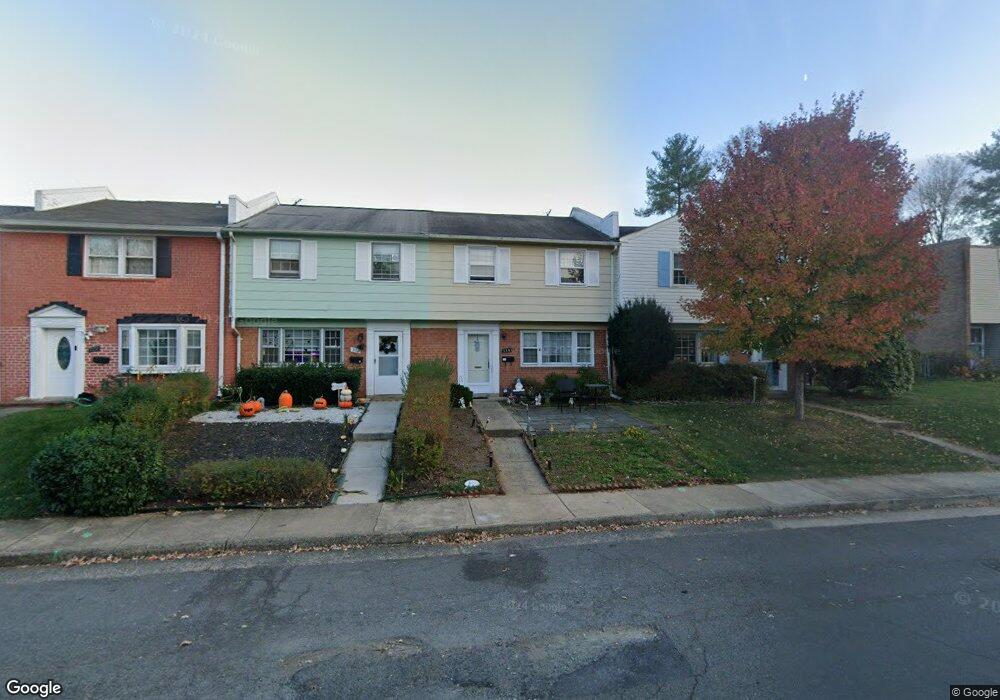
314 Shenandoah St SE Leesburg, VA 20175
Estimated Value: $396,000 - $462,000
3
Beds
2
Baths
1,200
Sq Ft
$353/Sq Ft
Est. Value
About This Home
This home is located at 314 Shenandoah St SE, Leesburg, VA 20175 and is currently estimated at $424,176, approximately $353 per square foot. 314 Shenandoah St SE is a home located in Loudoun County with nearby schools including Frederick Douglass Elementary School, J. Lupton Simpson Middle School, and Loudoun County High School.
Ownership History
Date
Name
Owned For
Owner Type
Purchase Details
Closed on
Dec 12, 2019
Sold by
Safa Pouya and Safa Sarah L
Bought by
Safa Pouya and Safa Sarah L
Current Estimated Value
Purchase Details
Closed on
Nov 20, 2015
Sold by
Safa Pouya
Bought by
Safa Poya and Safa Sarah L
Home Financials for this Owner
Home Financials are based on the most recent Mortgage that was taken out on this home.
Original Mortgage
$156,500
Outstanding Balance
$123,011
Interest Rate
3.77%
Mortgage Type
New Conventional
Estimated Equity
$301,165
Purchase Details
Closed on
Mar 27, 2002
Sold by
Borkenhagen Holly G
Bought by
Safa Pouya
Home Financials for this Owner
Home Financials are based on the most recent Mortgage that was taken out on this home.
Original Mortgage
$107,900
Interest Rate
6.88%
Mortgage Type
New Conventional
Purchase Details
Closed on
Sep 30, 1999
Sold by
Clemmer R Michael
Bought by
Borkenhagen Holly G and Gray,Melinda
Home Financials for this Owner
Home Financials are based on the most recent Mortgage that was taken out on this home.
Original Mortgage
$82,100
Interest Rate
7.85%
Create a Home Valuation Report for This Property
The Home Valuation Report is an in-depth analysis detailing your home's value as well as a comparison with similar homes in the area
Home Values in the Area
Average Home Value in this Area
Purchase History
| Date | Buyer | Sale Price | Title Company |
|---|---|---|---|
| Safa Pouya | -- | None Available | |
| Safa Poya | -- | None Available | |
| Safa Pouya | $119,920 | -- | |
| Borkenhagen Holly G | $86,500 | -- |
Source: Public Records
Mortgage History
| Date | Status | Borrower | Loan Amount |
|---|---|---|---|
| Open | Safa Poya | $156,500 | |
| Previous Owner | Safa Pouya | $107,900 | |
| Previous Owner | Borkenhagen Holly G | $82,100 |
Source: Public Records
Tax History Compared to Growth
Tax History
| Year | Tax Paid | Tax Assessment Tax Assessment Total Assessment is a certain percentage of the fair market value that is determined by local assessors to be the total taxable value of land and additions on the property. | Land | Improvement |
|---|---|---|---|---|
| 2025 | $3,054 | $379,410 | $160,000 | $219,410 |
| 2024 | $3,086 | $356,810 | $130,000 | $226,810 |
| 2023 | $3,026 | $345,800 | $130,000 | $215,800 |
| 2022 | $2,706 | $304,090 | $100,000 | $204,090 |
| 2021 | $2,715 | $277,060 | $95,000 | $182,060 |
| 2020 | $2,662 | $257,150 | $90,000 | $167,150 |
| 2019 | $2,581 | $246,990 | $75,000 | $171,990 |
| 2018 | $2,486 | $229,110 | $60,000 | $169,110 |
| 2017 | $2,398 | $213,190 | $60,000 | $153,190 |
| 2016 | $2,322 | $202,830 | $0 | $0 |
| 2015 | $346 | $129,330 | $0 | $129,330 |
| 2014 | $331 | $125,920 | $0 | $125,920 |
Source: Public Records
Map
Nearby Homes
- 214 Shenandoah St SE
- 135 Oak View Dr SE
- 664 Gateway Dr SE Unit 314
- 678 Gateway Dr SE Unit 907
- 265 High Rail Terrace SE
- 421 Bicksler Square SE
- 589 Rockbridge Dr SE
- 411 Bicksler Square SE
- 459 Kornblau Terrace SE
- 202 Murdoch Square SE
- 118 Fort Evans Rd SE Unit C
- 414 Madison Ct SE
- 316 Baish Dr SE
- 101 Fort Evans Rd SE Unit F
- 503 Sunset View Terrace SE Unit 208
- 502 Sunset View Terrace SE Unit 107
- 5 Stationmaster St SE Unit 202
- 508 Sunset View Terrace SE Unit 208
- 134 Shirley Square SE
- 3 Stationmaster St SE Unit 402
- 312 Shenandoah St SE
- 316 Shenandoah St SE
- 310 Shenandoah St SE
- 308 Shenandoah St SE
- 320 Shenandoah St SE
- 306 Shenandoah St SE
- 322 Shenandoah St SE
- 304 Shenandoah St SE
- 324 Shenandoah St SE
- 313 Roanoke Dr SE
- 311 Roanoke Dr SE
- 315 Roanoke Dr SE
- 317 Roanoke Dr SE
- 309 Roanoke Dr SE
- 302 Shenandoah St SE
- 307 Roanoke Dr SE
- 319 Roanoke Dr SE
- 326 Shenandoah St SE
- 305 Roanoke Dr SE
- 321 Roanoke Dr SE