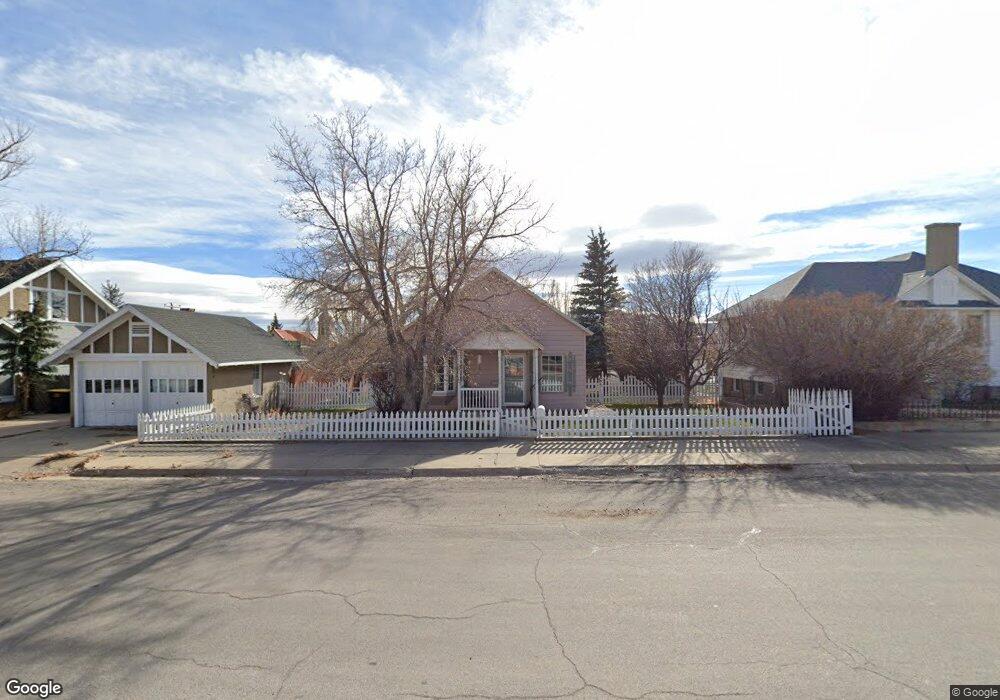
314 W Maple St Rawlins, WY 82301
Estimated Value: $170,000 - $216,000
2
Beds
1
Bath
1,392
Sq Ft
$135/Sq Ft
Est. Value
About This Home
This home is located at 314 W Maple St, Rawlins, WY 82301 and is currently estimated at $188,024, approximately $135 per square foot. 314 W Maple St is a home located in Carbon County with nearby schools including Rawlins Elementary School, Rawlins Middle School, and Rawlins High School.
Ownership History
Date
Name
Owned For
Owner Type
Purchase Details
Closed on
Jul 13, 2024
Sold by
Burns Eleanor A
Bought by
Brophy Emily B
Current Estimated Value
Home Financials for this Owner
Home Financials are based on the most recent Mortgage that was taken out on this home.
Original Mortgage
$174,242
Outstanding Balance
$172,161
Interest Rate
6.99%
Mortgage Type
New Conventional
Estimated Equity
$15,863
Purchase Details
Closed on
Oct 29, 2020
Sold by
Smith Neil E and Smith Valorie R
Bought by
Burns Eleanor A
Home Financials for this Owner
Home Financials are based on the most recent Mortgage that was taken out on this home.
Original Mortgage
$156,565
Interest Rate
2.9%
Mortgage Type
New Conventional
Purchase Details
Closed on
Jul 12, 2010
Sold by
Johnson Larry Don and Johnson Marie
Bought by
Smith Neil E and Smith Valorie R
Home Financials for this Owner
Home Financials are based on the most recent Mortgage that was taken out on this home.
Original Mortgage
$143,058
Interest Rate
4.77%
Mortgage Type
Future Advance Clause Open End Mortgage
Create a Home Valuation Report for This Property
The Home Valuation Report is an in-depth analysis detailing your home's value as well as a comparison with similar homes in the area
Purchase History
We collect this data history from publicly available records. To have your information removed, we recommend requesting removal directly through your county’s website.
| Date | Buyer | Sale Price | Title Company |
|---|---|---|---|
| Brophy Emily B | -- | First American Title | |
| Burns Eleanor A | -- | First American Title | |
| Smith Neil E | -- | None Available |
Source: Public Records
Mortgage History
We collect this data history from publicly available records. To have your information removed, we recommend requesting removal directly through your county’s website.
| Date | Status | Borrower | Loan Amount |
|---|---|---|---|
| Open | Brophy Emily B | $174,242 | |
| Previous Owner | Burns Eleanor A | $156,565 | |
| Previous Owner | Smith Neil E | $143,058 |
Source: Public Records
Tax History
| Year | Tax Paid | Tax Assessment Tax Assessment Total Assessment is a certain percentage of the fair market value that is determined by local assessors to be the total taxable value of land and additions on the property. | Land | Improvement |
|---|---|---|---|---|
| 2025 | $1,006 | $11,775 | $2,354 | $9,421 |
| 2024 | $10 | $13,936 | $2,778 | $11,158 |
| 2023 | $1,019 | $14,107 | $2,697 | $11,410 |
| 2022 | $877 | $11,986 | $2,697 | $9,289 |
| 2021 | $877 | $11,392 | $2,697 | $8,695 |
| 2020 | $868 | $36,030 | $8,091 | $27,939 |
| 2019 | $941 | $13,085 | $2,697 | $10,388 |
| 2018 | $978 | $13,385 | $2,697 | $10,688 |
| 2017 | $961 | $13,216 | $2,697 | $10,519 |
| 2016 | $953 | $13,107 | $2,244 | $10,863 |
| 2015 | -- | $12,782 | $2,244 | $10,538 |
| 2014 | -- | $12,534 | $2,161 | $10,373 |
Source: Public Records
Map
Nearby Homes
- Lot 21 Cottonwood Village
- 419 6th St
- 607 W Maple St
- Lot 20
- Lot 19 Cottonwood Village
- 222 E Maple St
- 221 E Pine St
- 924 7th St
- 115 E Cedar St
- 112 6th St
- 405 Daley St
- 508 Rodeo Ct
- 518 E Spruce St
- 1115 W Maple St
- 1120 W Maple St
- 323 McMicken St
- 1021 N Jeffers Dr
- 546 W State St
- 608 W State St
- 506 W State St
- 314 W Maple St Unit 3rd
- 320 W Maple St
- 520 3rd St
- 313 W Spruce St
- 315 W Spruce St
- 315 W Maple St
- 311 W Maple St
- 604 3rd St Unit Maple
- 319 W Maple St
- 516 4th St Unit Spruce Street
- 520 4th St Unit Maple
- 610 3rd St
- 515 3rd St
- 220 W Maple St
- 508 4th St
- 401 W Maple St
- 415 W Spruce St
- 221 W Spruce St Unit 3RD Street
- 221 W Spruce St Unit 3rd
- 618 3rd St
Your Personal Tour Guide
Ask me questions while you tour the home.