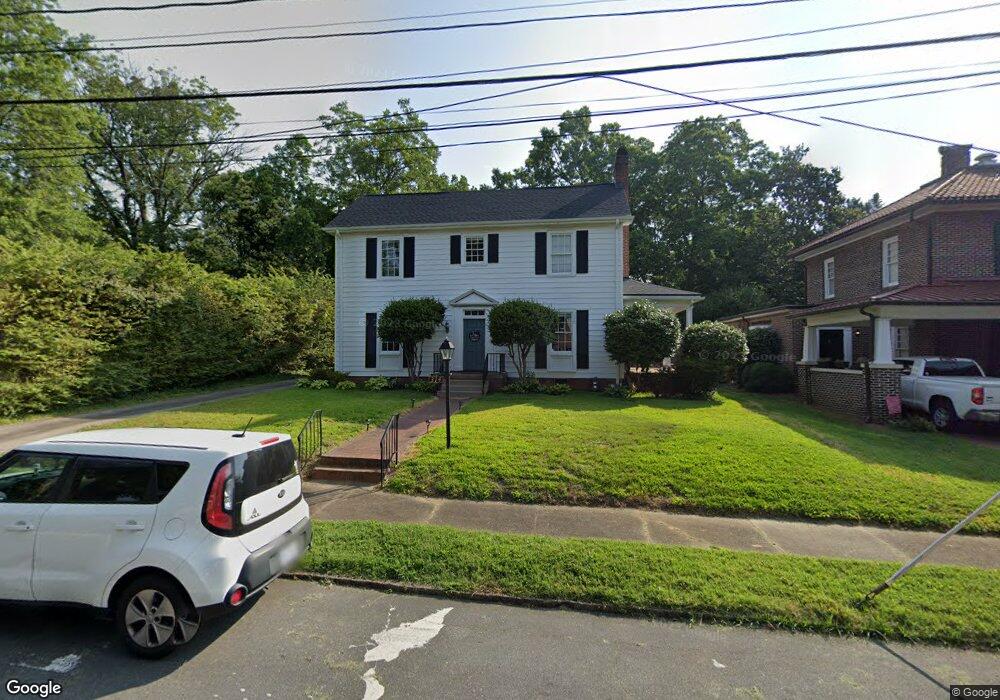
314 W Marsh St Unit 12 Salisbury, NC 28144
Estimated Value: $389,000 - $430,000
--
Bed
3
Baths
3,307
Sq Ft
$125/Sq Ft
Est. Value
About This Home
This home is located at 314 W Marsh St Unit 12, Salisbury, NC 28144 and is currently estimated at $412,003, approximately $124 per square foot. 314 W Marsh St Unit 12 is a home located in Rowan County with nearby schools including Elizabeth Duncan Koontz Elementary School, Knox Middle School, and North Rowan Middle School.
Ownership History
Date
Name
Owned For
Owner Type
Purchase Details
Closed on
Oct 12, 2020
Sold by
Foley Jeffrey and Foley Debora W
Bought by
Carey Philip B and Evers Samantha P
Current Estimated Value
Home Financials for this Owner
Home Financials are based on the most recent Mortgage that was taken out on this home.
Original Mortgage
$256,500
Outstanding Balance
$228,143
Interest Rate
2.9%
Mortgage Type
New Conventional
Estimated Equity
$183,860
Purchase Details
Closed on
Feb 27, 2018
Sold by
Temple Sydney Dowd
Bought by
Foley Jeffrey D and Foley Debora W
Home Financials for this Owner
Home Financials are based on the most recent Mortgage that was taken out on this home.
Original Mortgage
$163,305
Interest Rate
4.04%
Mortgage Type
New Conventional
Purchase Details
Closed on
Jul 20, 2017
Sold by
Temple Sydney Dowd and Temple Kathryn Clement
Bought by
Temple Sydney Dowd
Purchase Details
Closed on
Dec 3, 1998
Bought by
Temple Sydney Dowd and Temple Wf
Create a Home Valuation Report for This Property
The Home Valuation Report is an in-depth analysis detailing your home's value as well as a comparison with similar homes in the area
Home Values in the Area
Average Home Value in this Area
Purchase History
| Date | Buyer | Sale Price | Title Company |
|---|---|---|---|
| Carey Philip B | $270,000 | None Available | |
| Foley Jeffrey D | $172,000 | None Available | |
| Temple Sydney Dowd | -- | None Available | |
| Temple Sydney Dowd | $165,000 | -- |
Source: Public Records
Mortgage History
| Date | Status | Borrower | Loan Amount |
|---|---|---|---|
| Open | Carey Philip B | $256,500 | |
| Previous Owner | Foley Jeffrey D | $163,305 |
Source: Public Records
Tax History Compared to Growth
Tax History
| Year | Tax Paid | Tax Assessment Tax Assessment Total Assessment is a certain percentage of the fair market value that is determined by local assessors to be the total taxable value of land and additions on the property. | Land | Improvement |
|---|---|---|---|---|
| 2025 | $4,202 | $351,303 | $27,825 | $323,478 |
| 2024 | $4,202 | $351,303 | $27,825 | $323,478 |
| 2023 | $4,202 | $351,303 | $27,825 | $323,478 |
| 2022 | $2,899 | $210,486 | $24,115 | $186,371 |
| 2021 | $2,899 | $210,486 | $24,115 | $186,371 |
| 2020 | $2,899 | $210,486 | $24,115 | $186,371 |
| 2019 | $2,899 | $210,486 | $24,115 | $186,371 |
| 2018 | $2,611 | $192,203 | $24,115 | $168,088 |
| 2017 | $2,598 | $192,203 | $24,115 | $168,088 |
| 2016 | $2,526 | $192,203 | $24,115 | $168,088 |
| 2015 | $2,542 | $192,203 | $24,115 | $168,088 |
| 2014 | $2,585 | $197,781 | $24,115 | $173,666 |
Source: Public Records
Map
Nearby Homes
- 603 S Fulton St
- 420 S Jackson St
- 300 W Thomas St
- 209 W Marsh St
- 418 S Fulton St
- 701 S Fulton St
- 414 S Fulton St
- 719 S Jackson St
- 300 W Horah St
- 408 S Ellis St
- 629 S Caldwell St
- 321 W Bank St
- 222 W McCubbins St
- 115 W Thomas St
- 525 W Horah St Unit Lot 9
- 322 S Church St
- 617 W Horah St
- 326 S Caldwell St
- 817 S Jackson St
- 300 S Main St Unit K
- 314 W Marsh St
- 310 W Marsh St
- 529 S Fulton St
- 519 S Fulton St
- 514 S Jackson St
- 300 W Marsh St
- 507 S Fulton St
- 325 W Marsh St
- 603 N Fulton St
- 510 S Jackson St
- 607 S Fulton St
- 303 W Marsh St
- 301 W Marsh St
- 500 S Jackson St
- 230 W Marsh St
- 528 S Fulton St
- 613 S Fulton St
- 520 S Fulton St
- 602 S Fulton St
- 228 W Marsh St