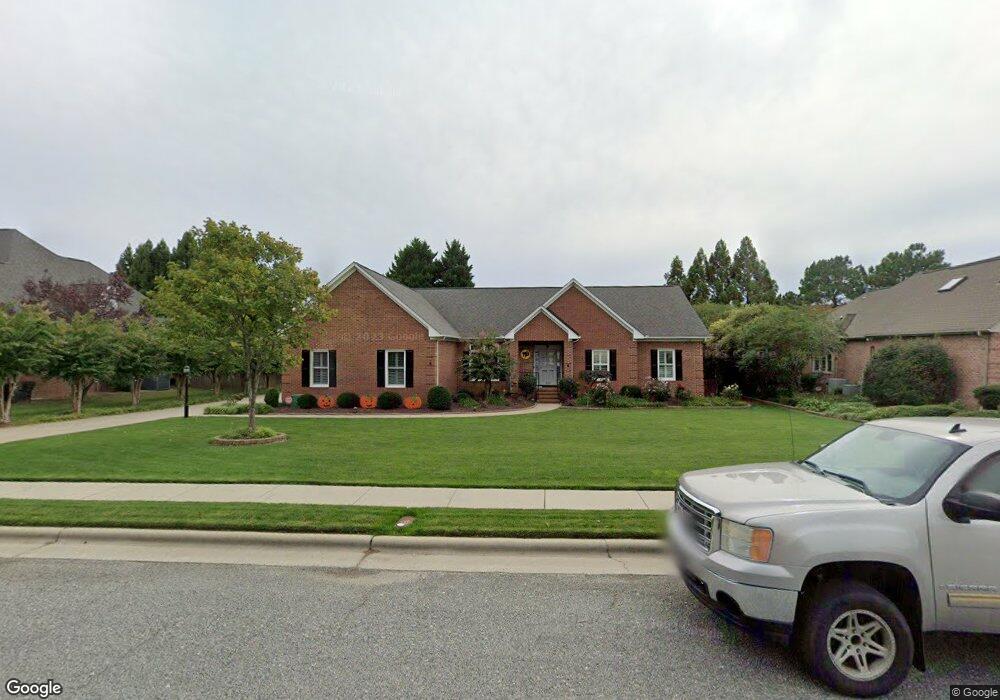
3140 Abingdon Place Burlington, NC 27215
West Burlington NeighborhoodEstimated Value: $525,000 - $560,000
4
Beds
3
Baths
2,670
Sq Ft
$202/Sq Ft
Est. Value
About This Home
This home is located at 3140 Abingdon Place, Burlington, NC 27215 and is currently estimated at $539,021, approximately $201 per square foot. 3140 Abingdon Place is a home located in Alamance County with nearby schools including Marvin B. Smith Elementary School, Turrentine Middle School, and Walter M. Williams High School.
Ownership History
Date
Name
Owned For
Owner Type
Purchase Details
Closed on
Jun 11, 2009
Sold by
Coley Carl B
Bought by
Grayson Gregory
Current Estimated Value
Home Financials for this Owner
Home Financials are based on the most recent Mortgage that was taken out on this home.
Original Mortgage
$275,793
Outstanding Balance
$174,250
Interest Rate
4.77%
Mortgage Type
FHA
Estimated Equity
$364,771
Purchase Details
Closed on
Jan 21, 2009
Sold by
Simpson John Lewis
Bought by
Coley Carl B
Purchase Details
Closed on
Jun 14, 2005
Sold by
Herman Gary L
Bought by
Coley Carl B
Home Financials for this Owner
Home Financials are based on the most recent Mortgage that was taken out on this home.
Original Mortgage
$250,000
Interest Rate
5.7%
Mortgage Type
New Conventional
Purchase Details
Closed on
Jan 29, 2001
Sold by
Braxton Donald E
Bought by
Herman Gary L
Home Financials for this Owner
Home Financials are based on the most recent Mortgage that was taken out on this home.
Original Mortgage
$241,200
Interest Rate
7.18%
Create a Home Valuation Report for This Property
The Home Valuation Report is an in-depth analysis detailing your home's value as well as a comparison with similar homes in the area
Home Values in the Area
Average Home Value in this Area
Purchase History
| Date | Buyer | Sale Price | Title Company |
|---|---|---|---|
| Grayson Gregory | $330,000 | -- | |
| Coley Carl B | $91,000 | -- | |
| Coley Carl B | $325,000 | -- | |
| Herman Gary L | $301,500 | -- |
Source: Public Records
Mortgage History
| Date | Status | Borrower | Loan Amount |
|---|---|---|---|
| Open | Grayson Gregory | $275,793 | |
| Previous Owner | Coley Carl B | $250,000 | |
| Previous Owner | Herman Gary L | $241,200 |
Source: Public Records
Tax History Compared to Growth
Tax History
| Year | Tax Paid | Tax Assessment Tax Assessment Total Assessment is a certain percentage of the fair market value that is determined by local assessors to be the total taxable value of land and additions on the property. | Land | Improvement |
|---|---|---|---|---|
| 2025 | $2,318 | $469,134 | $60,000 | $409,134 |
| 2024 | $2,200 | $469,134 | $60,000 | $409,134 |
| 2023 | $4,274 | $469,134 | $60,000 | $409,134 |
| 2022 | $4,033 | $324,967 | $65,000 | $259,967 |
| 2021 | $4,065 | $324,967 | $65,000 | $259,967 |
| 2020 | $4,098 | $324,967 | $65,000 | $259,967 |
| 2019 | $4,109 | $324,967 | $65,000 | $259,967 |
| 2018 | $1,931 | $324,967 | $65,000 | $259,967 |
| 2017 | $1,875 | $324,967 | $65,000 | $259,967 |
| 2016 | $3,803 | $327,883 | $65,000 | $262,883 |
| 2015 | $1,892 | $327,883 | $65,000 | $262,883 |
| 2014 | $1,729 | $327,883 | $65,000 | $262,883 |
Source: Public Records
Map
Nearby Homes
- 128 Fieldstone Dr
- 115 Coachlight Trail
- 509 Fieldstone Dr
- 1246 Jamestowne Dr
- 400 Brickwalk Ct
- 713 Mill Pointe Way
- 240 Coachlight Trail
- 102 Westgate Dr
- 3489 Forestdale Dr Unit 1C
- 3489 Forestdale Dr Unit 2d
- 2941 Amherst Ave
- 420 Collinwood Dr
- 2825 Bedford St
- 480 Whitt Ave
- 622 & 624 S Williamson Ave
- 622-624 S Williamson Ave
- 2804 Edgewood Ave
- 3424 Garden Rd
- 3132 Abingdon Place
- 3148 Abingdon Place
- 3125 Kensington Place
- 3119 Kensington Place
- 3147 Abingdon Place
- 3139 Abingdon Place
- 3124 Abingdon Place
- 3133 Kensington Place
- 3156 Abingdon Place
- 3129 Abingdon Place
- 3116 Abingdon Place
- 0 Kensington
- 3123 Abingdon Place
- 3108 Kensington Place
- 3164 Abingdon Place
- 622 Meadowood Dr
- 630 Meadowood Dr
- 3130 Kensington Place
- 520 Meadowood Dr