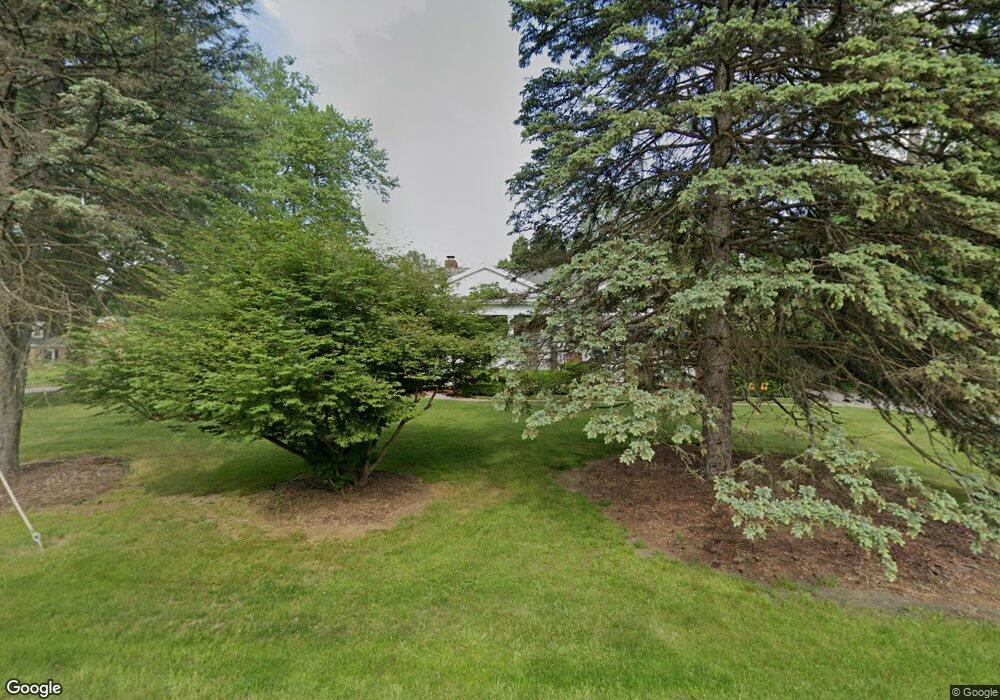
3140 Corey Rd Toledo, OH 43615
Estimated Value: $371,000 - $426,000
4
Beds
3
Baths
3,151
Sq Ft
$125/Sq Ft
Est. Value
About This Home
This home is located at 3140 Corey Rd, Toledo, OH 43615 and is currently estimated at $392,780, approximately $124 per square foot. 3140 Corey Rd is a home located in Lucas County with nearby schools including Whiteford Elementary School, Sylvania Arbor Hills Junior High School, and Sylvania Southview High School.
Ownership History
Date
Name
Owned For
Owner Type
Purchase Details
Closed on
Jun 28, 2002
Sold by
Corporate Transfer Service Inc
Bought by
Moreland Calvin and Moreland Madeline
Current Estimated Value
Home Financials for this Owner
Home Financials are based on the most recent Mortgage that was taken out on this home.
Original Mortgage
$179,900
Outstanding Balance
$76,696
Interest Rate
6.79%
Estimated Equity
$316,084
Purchase Details
Closed on
May 20, 2002
Sold by
Delapena James R and Leigh Carrie
Bought by
Corporate Transfer Service Inc
Home Financials for this Owner
Home Financials are based on the most recent Mortgage that was taken out on this home.
Original Mortgage
$179,900
Outstanding Balance
$76,696
Interest Rate
6.79%
Estimated Equity
$316,084
Purchase Details
Closed on
Oct 7, 1996
Sold by
Patik Joseph F
Bought by
Delapena James R
Create a Home Valuation Report for This Property
The Home Valuation Report is an in-depth analysis detailing your home's value as well as a comparison with similar homes in the area
Home Values in the Area
Average Home Value in this Area
Purchase History
| Date | Buyer | Sale Price | Title Company |
|---|---|---|---|
| Moreland Calvin | $239,900 | Northwest Title Agency Of Oh | |
| Corporate Transfer Service Inc | $239,900 | Northwest Title Agency Of Oh | |
| Delapena James R | $180,000 | -- |
Source: Public Records
Mortgage History
| Date | Status | Borrower | Loan Amount |
|---|---|---|---|
| Open | Moreland Calvin | $179,900 |
Source: Public Records
Tax History Compared to Growth
Tax History
| Year | Tax Paid | Tax Assessment Tax Assessment Total Assessment is a certain percentage of the fair market value that is determined by local assessors to be the total taxable value of land and additions on the property. | Land | Improvement |
|---|---|---|---|---|
| 2024 | $3,648 | $126,385 | $9,765 | $116,620 |
| 2023 | $5,297 | $76,405 | $7,910 | $68,495 |
| 2022 | $5,296 | $76,405 | $7,910 | $68,495 |
| 2021 | $5,392 | $76,405 | $7,910 | $68,495 |
| 2020 | $5,099 | $62,685 | $6,510 | $56,175 |
| 2019 | $4,982 | $62,685 | $6,510 | $56,175 |
| 2018 | $4,896 | $62,685 | $6,510 | $56,175 |
| 2017 | $5,115 | $59,325 | $8,645 | $50,680 |
| 2016 | $5,083 | $169,500 | $24,700 | $144,800 |
| 2015 | $4,792 | $169,500 | $24,700 | $144,800 |
| 2014 | $4,354 | $59,330 | $8,650 | $50,680 |
| 2013 | $4,354 | $59,330 | $8,650 | $50,680 |
Source: Public Records
Map
Nearby Homes
- 4545 Indian Rd
- 3439 Shakespeare Ln
- 3450 Shakespeare Ln
- 3205 Talmadge Rd
- 3221 Talmadge Rd
- 4239 W Central Ave
- 2720 Derby Rd
- 2949 Secretariat Rd
- 3555 Hill River Dr
- 4921 Pine Ridge Rd
- 4906 Pine Ridge Rd
- 4039 Marlaine Dr
- 5212 Regency Dr
- 4028 Brookside Rd
- 2901 Evergreen Rd
- 4705 W Bancroft St
- 4709 W Bancroft St
- 3446 Stanhope Dr
- 4519 W Bancroft St
- 2222 Talmadge Rd
- 4639 Cranbrook Dr
- 3202 Corey Rd
- 4629 Cranbrook Dr
- 4640 Cranbrook Dr
- 4650 W Central Ave
- 4606 Cranbrook Dr
- 4630 Cranbrook Dr
- 4619 Cranbrook Dr
- 4630 W Central Ave
- 3216 Corey Rd
- 4620 Cranbrook Dr
- 3221 Shakespeare Ln
- 4605 Cranbrook Dr
- 3220 Shakespeare Ln
- 4600 Cranbrook Dr
- 3228 Corey Rd
- 4620 W Central Ave
- 3227 Shakespeare Ln
- 4606 W Central Ave
- 3242 Corey Rd