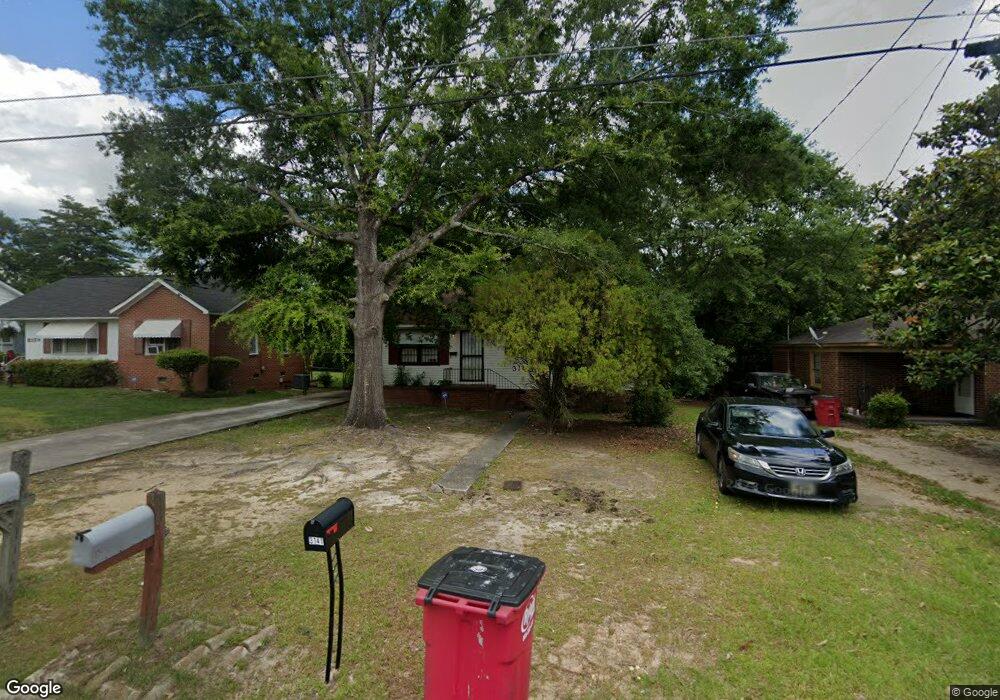
3140 Somerset Dr Macon, GA 31206
Estimated Value: $65,000 - $119,000
3
Beds
1
Bath
936
Sq Ft
$88/Sq Ft
Est. Value
About This Home
This home is located at 3140 Somerset Dr, Macon, GA 31206 and is currently estimated at $82,105, approximately $87 per square foot. 3140 Somerset Dr is a home located in Bibb County with nearby schools including Hartley Elementary School, Southwest High School, and Cirrus Charter Academy.
Ownership History
Date
Name
Owned For
Owner Type
Purchase Details
Closed on
Oct 15, 2020
Sold by
Wilson Covian
Bought by
Shandler Anna
Current Estimated Value
Purchase Details
Closed on
May 2, 2017
Sold by
Haywood James Edward
Bought by
Roy Properties Llc
Purchase Details
Closed on
Jul 21, 2006
Sold by
Referral Homes Inc
Bought by
Haywood Jame Edward
Home Financials for this Owner
Home Financials are based on the most recent Mortgage that was taken out on this home.
Original Mortgage
$59,300
Interest Rate
10.15%
Mortgage Type
Adjustable Rate Mortgage/ARM
Purchase Details
Closed on
May 3, 2006
Sold by
Referral Homes Inc
Bought by
Coleman Properties Inc
Purchase Details
Closed on
Apr 10, 2006
Sold by
Mcneely Rose D
Bought by
Coleman Properties Inc
Purchase Details
Closed on
Jan 14, 2004
Purchase Details
Closed on
Mar 10, 2000
Create a Home Valuation Report for This Property
The Home Valuation Report is an in-depth analysis detailing your home's value as well as a comparison with similar homes in the area
Home Values in the Area
Average Home Value in this Area
Purchase History
| Date | Buyer | Sale Price | Title Company |
|---|---|---|---|
| Shandler Anna | $20,000 | None Available | |
| Roy Properties Llc | $4,500 | -- | |
| Haywood Jame Edward | $659,000 | None Avelable | |
| Coleman Properties Inc | $42,201 | None Availabale | |
| Referral Homes Inc | $43,000 | None Available | |
| Coleman Properties Inc | $20,000 | None Available | |
| -- | -- | -- | |
| -- | -- | -- |
Source: Public Records
Mortgage History
| Date | Status | Borrower | Loan Amount |
|---|---|---|---|
| Previous Owner | Haywood Jame Edward | $59,300 |
Source: Public Records
Tax History Compared to Growth
Tax History
| Year | Tax Paid | Tax Assessment Tax Assessment Total Assessment is a certain percentage of the fair market value that is determined by local assessors to be the total taxable value of land and additions on the property. | Land | Improvement |
|---|---|---|---|---|
| 2025 | $476 | $19,382 | $2,600 | $16,782 |
| 2024 | $492 | $19,382 | $2,600 | $16,782 |
| 2023 | $437 | $17,210 | $2,080 | $15,130 |
| 2022 | $589 | $16,998 | $1,916 | $15,082 |
| 2021 | $389 | $10,242 | $1,552 | $8,690 |
| 2020 | $398 | $10,242 | $1,552 | $8,690 |
| 2019 | $363 | $9,265 | $1,460 | $7,805 |
| 2018 | $288 | $6,955 | $834 | $6,121 |
| 2017 | $256 | $6,840 | $834 | $6,006 |
| 2016 | $199 | $5,748 | $834 | $4,914 |
| 2015 | $281 | $5,748 | $834 | $4,914 |
| 2014 | $791 | $14,049 | $3,129 | $10,920 |
Source: Public Records
Map
Nearby Homes
- 3158 Brownell Ave
- 3064 Margaret Dr
- 3005 Margaret Dr
- 1138 Newberg Ave
- 999 Ponce de Leon Cir N
- 982 Ponce de Leon Cir S
- 997 Ponce de Leon Cir N
- 3210 Evergreen Dr
- 3242 Evergreen Dr
- 981 Perdue St
- 968 Quinlan Dr
- 932 Quinlan Dr
- 946 Ponce de Leon Cir
- 1254 W Grenada Terrace
- 3141 Edlay Place
- 1066 Jessamine St
- 1016 W Grenada Terrace
- 1124 N Beddingfield Dr
- 797 Newberg Ave
- 3132 Somerset Dr
- 3148 Somerset Dr
- 3124 Somerset Dr
- 3156 Somerset Dr
- 0 Somerset Dr Unit 8419219
- 3164 Somerset Dr
- 3116 Somerset Dr
- 3108 Hollis Rd
- 3141 Somerset Dr
- 3133 Somerset Dr
- 3108 Somerset Dr
- 3172 Somerset Dr
- 3149 Somerset Dr
- 3125 Somerset Dr
- 3157 Somerset Dr
- 3117 Somerset Dr
- 3102 Somerset Dr
- 3180 Somerset Dr
- 3165 Somerset Dr
- 3106 Brownell Ave