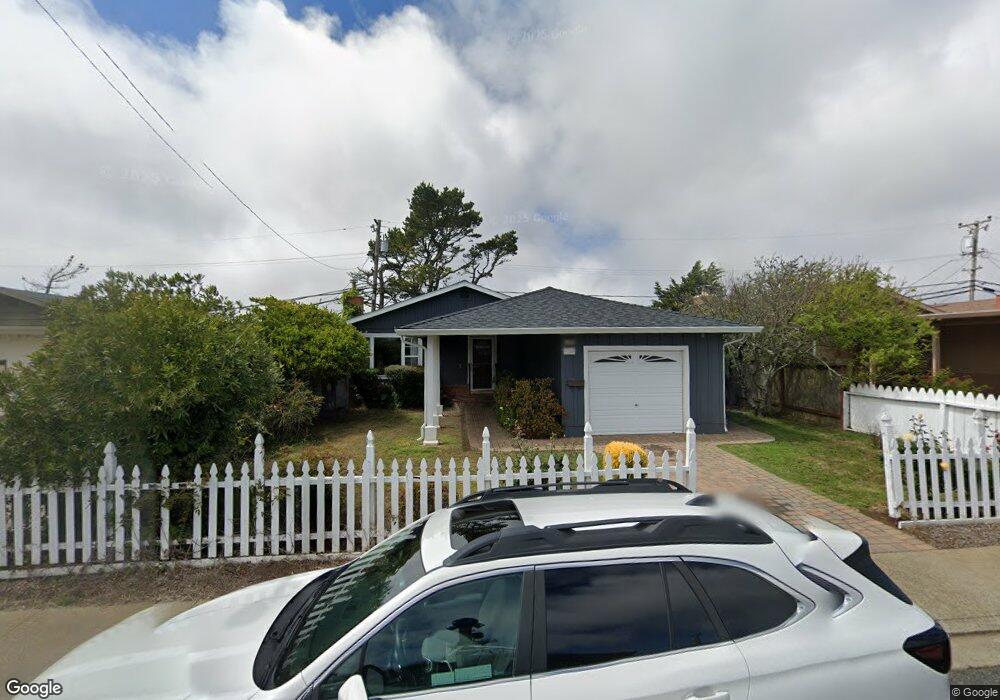
3140 Summit Rd San Bruno, CA 94066
Pacific Heights NeighborhoodEstimated Value: $1,111,000 - $1,217,000
3
Beds
2
Baths
1,170
Sq Ft
$1,004/Sq Ft
Est. Value
About This Home
This home is located at 3140 Summit Rd, San Bruno, CA 94066 and is currently estimated at $1,174,951, approximately $1,004 per square foot. 3140 Summit Rd is a home located in San Mateo County with nearby schools including Portola Elementary School, Parkside Intermediate School, and Capuchino High School.
Ownership History
Date
Name
Owned For
Owner Type
Purchase Details
Closed on
Nov 22, 2011
Sold by
Logia Cris N and Logia John Louis
Bought by
Arcenal Alan T and Arcenal Jo Ann
Current Estimated Value
Home Financials for this Owner
Home Financials are based on the most recent Mortgage that was taken out on this home.
Original Mortgage
$389,860
Outstanding Balance
$263,914
Interest Rate
3.87%
Mortgage Type
FHA
Estimated Equity
$911,037
Purchase Details
Closed on
Jun 13, 2011
Sold by
Logia Cris N and Logia John Louis
Bought by
Logia Cris N and Logia John Louis
Purchase Details
Closed on
Aug 21, 2006
Sold by
Logia Eluina A
Bought by
Logia John Louis
Purchase Details
Closed on
Sep 12, 1995
Sold by
Logia Elvina A and Logia Cris
Bought by
Logia Eluina A and Logia Cris
Home Financials for this Owner
Home Financials are based on the most recent Mortgage that was taken out on this home.
Original Mortgage
$207,000
Interest Rate
7.5%
Create a Home Valuation Report for This Property
The Home Valuation Report is an in-depth analysis detailing your home's value as well as a comparison with similar homes in the area
Home Values in the Area
Average Home Value in this Area
Purchase History
| Date | Buyer | Sale Price | Title Company |
|---|---|---|---|
| Arcenal Alan T | $400,000 | Chicago Title Company | |
| Logia Cris N | -- | Chicago Title Company | |
| Logia John Louis | -- | None Available | |
| Logia Eluina A | -- | North American Title Co |
Source: Public Records
Mortgage History
| Date | Status | Borrower | Loan Amount |
|---|---|---|---|
| Open | Arcenal Alan T | $389,860 | |
| Previous Owner | Logia Eluina A | $207,000 |
Source: Public Records
Tax History
| Year | Tax Paid | Tax Assessment Tax Assessment Total Assessment is a certain percentage of the fair market value that is determined by local assessors to be the total taxable value of land and additions on the property. | Land | Improvement |
|---|---|---|---|---|
| 2025 | $6,785 | $502,412 | $251,206 | $251,206 |
| 2023 | $6,785 | $482,904 | $241,452 | $241,452 |
| 2022 | $5,228 | $473,436 | $236,718 | $236,718 |
| 2021 | $5,160 | $464,154 | $232,077 | $232,077 |
| 2020 | $5,111 | $459,396 | $229,698 | $229,698 |
| 2019 | $5,027 | $450,390 | $225,195 | $225,195 |
| 2018 | $4,778 | $441,560 | $220,780 | $220,780 |
| 2017 | $4,726 | $432,902 | $216,451 | $216,451 |
| 2016 | $4,624 | $424,414 | $212,207 | $212,207 |
| 2015 | $4,562 | $418,040 | $209,020 | $209,020 |
| 2014 | $4,495 | $409,852 | $204,926 | $204,926 |
Source: Public Records
Map
Nearby Homes
- 3513 Bering Dr
- 2741 Oakmont Dr
- 370 Goodwin Dr
- 3392 Fleetwood Dr
- 868 Skyridge Dr
- 3550 Carter Dr Unit 101
- 3550 Carter Dr Unit 32
- 228 Goodwin Dr
- 2504 Ardee Ln
- 2401 Ardee Ln
- 2361 Oakmont Dr
- 2625 Duhallow Way
- 2728 Kilconway Ln
- 2405 Liberty Ct
- 2651 Evergreen Dr
- 101 Elmwood Ct
- 3734 Myrna Ln
- 2485 Wexford Ave
- 2755 Shannon Dr
- 22 Buena Vista Rd
Your Personal Tour Guide
Ask me questions while you tour the home.