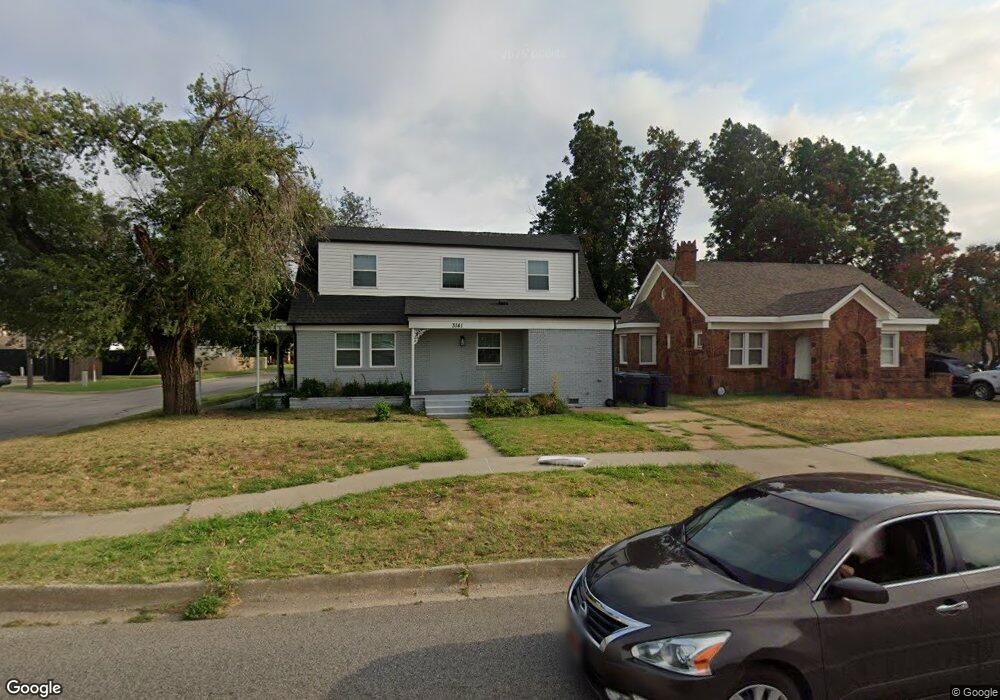
3141 NW 23rd St Oklahoma City, OK 73107
Denniston Park NeighborhoodEstimated Value: $204,000 - $245,000
3
Beds
3
Baths
2,170
Sq Ft
$102/Sq Ft
Est. Value
About This Home
This home is located at 3141 NW 23rd St, Oklahoma City, OK 73107 and is currently estimated at $221,865, approximately $102 per square foot. 3141 NW 23rd St is a home located in Oklahoma County with nearby schools including Kaiser Elementary School, Taft Middle School, and Northwest Classen High School.
Ownership History
Date
Name
Owned For
Owner Type
Purchase Details
Closed on
Jul 20, 2022
Sold by
Islas Devlan R and Islas Kathleen D
Bought by
Evergrand Investment Group Llc
Current Estimated Value
Purchase Details
Closed on
Mar 31, 2014
Sold by
Spears Jack E
Bought by
Islas Devlan R and Islas Kathleen D
Home Financials for this Owner
Home Financials are based on the most recent Mortgage that was taken out on this home.
Original Mortgage
$90,000
Interest Rate
4.38%
Mortgage Type
New Conventional
Purchase Details
Closed on
Sep 26, 2003
Sold by
Howerton Ruth Ann and Howerton Donald Allen
Bought by
Spears Jack E
Purchase Details
Closed on
Sep 19, 2003
Sold by
Crain Albert Lyle and Crain Mary E
Bought by
Spears Jack E
Purchase Details
Closed on
Sep 25, 2002
Sold by
Kelley James P and Kelley Gerald E
Bought by
Gilbert Jerry A
Purchase Details
Closed on
Oct 4, 2001
Sold by
Crain Mary Ruth
Bought by
Howerton Ruth Ann and Crain Albert Lyle
Create a Home Valuation Report for This Property
The Home Valuation Report is an in-depth analysis detailing your home's value as well as a comparison with similar homes in the area
Home Values in the Area
Average Home Value in this Area
Purchase History
| Date | Buyer | Sale Price | Title Company |
|---|---|---|---|
| Evergrand Investment Group Llc | $140,000 | American Security Title | |
| Islas Devlan R | $120,000 | American Eagle Title Group | |
| Spears Jack E | $45,000 | American Guaranty Title Co | |
| Spears Jack E | $45,000 | American Guaranty Title Co | |
| Gilbert Jerry A | $11,000 | -- | |
| Howerton Ruth Ann | -- | -- |
Source: Public Records
Mortgage History
| Date | Status | Borrower | Loan Amount |
|---|---|---|---|
| Previous Owner | Islas Devlan R | $90,000 |
Source: Public Records
Tax History Compared to Growth
Tax History
| Year | Tax Paid | Tax Assessment Tax Assessment Total Assessment is a certain percentage of the fair market value that is determined by local assessors to be the total taxable value of land and additions on the property. | Land | Improvement |
|---|---|---|---|---|
| 2024 | $1,885 | $15,675 | $3,489 | $12,186 |
| 2023 | $1,885 | $15,345 | $3,489 | $11,856 |
| 2022 | $1,617 | $13,744 | $3,488 | $10,256 |
| 2021 | $1,541 | $13,090 | $3,489 | $9,601 |
| 2020 | $1,559 | $13,090 | $3,111 | $9,979 |
| 2019 | $1,558 | $13,090 | $3,111 | $9,979 |
| 2018 | $1,491 | $13,145 | $0 | $0 |
| 2017 | $1,490 | $13,144 | $3,111 | $10,033 |
| 2016 | $1,503 | $13,254 | $2,509 | $10,745 |
| 2015 | $1,519 | $13,265 | $2,509 | $10,756 |
| 2014 | $1,643 | $14,430 | $2,509 | $11,921 |
Source: Public Records
Map
Nearby Homes
- 3117 NW 23rd St
- 3217 NW 22nd St
- 3105 NW 22nd St
- 3157 NW 25th St
- 3104 NW 21st St
- 3013 NW 24th St
- 3232 NW 21st St
- 3316 NW 26th St
- 2208 N Brookline Ave
- 3216 NW 19th St
- 3004 Pioneer Ave
- 3016 NW 28th St
- 3416 NW 20th St
- 3437 NW 20th St
- 3217 NW 29th St
- 3429 NW 19th St
- 3101 NW 29th St
- 3128 NW 30th St
- 2841 NW 20th St
- 1819 N Woodward Ave
- 3145 NW 23rd St
- 3139 NW 23rd St
- 3150 NW 24th St
- 3148 NW 24th St
- 3200 NW 24th St
- 3140 NW 24th St
- 3204 NW 24th St
- 3134 NW 24th St
- 3208 NW 24th St
- 3134 NW 24th St
- 3130 NW 23rd St
- 3202 NW 23rd St
- 3212 NW 24th St
- 3204 NW 23rd St
- 3217 NW 23rd St
- 3161 NW 24th St
- 3157 NW 24th St
- 3120 NW 23rd St
- 3216 NW 24th St
- 3208 NW 23rd St