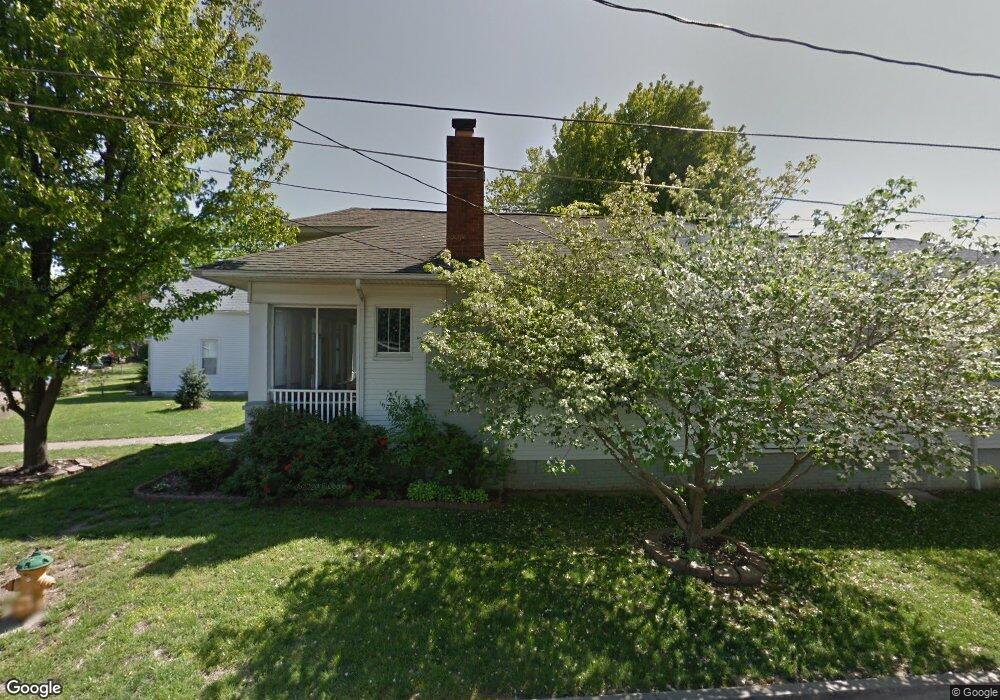
3142 Arlington Ave Evansville, IN 47712
Estimated Value: $80,000 - $179,304
3
Beds
2
Baths
1,712
Sq Ft
$88/Sq Ft
Est. Value
About This Home
This home is located at 3142 Arlington Ave, Evansville, IN 47712 and is currently estimated at $151,076, approximately $88 per square foot. 3142 Arlington Ave is a home located in Vanderburgh County with nearby schools including Daniel Wertz Elementary School, Perry Heights Middle School, and Francis Joseph Reitz High School.
Ownership History
Date
Name
Owned For
Owner Type
Purchase Details
Closed on
Jun 20, 2023
Sold by
Bankunited Na
Bought by
Cra Real Estate Llc
Current Estimated Value
Purchase Details
Closed on
Sep 29, 2022
Sold by
Sheriff Of Vanderburgh County Indiana
Bought by
Bank United Na
Purchase Details
Closed on
Sep 25, 2008
Sold by
Yates Amber and Yates Steven
Bought by
Skeels Gerald W and Skeels Jo Ann
Home Financials for this Owner
Home Financials are based on the most recent Mortgage that was taken out on this home.
Original Mortgage
$103,123
Interest Rate
6.43%
Mortgage Type
FHA
Purchase Details
Closed on
Jun 16, 2005
Sold by
Seib Brett W and Seib Rebecca A
Bought by
Yates Amber and Yates Steven
Home Financials for this Owner
Home Financials are based on the most recent Mortgage that was taken out on this home.
Original Mortgage
$98,000
Interest Rate
5.75%
Mortgage Type
New Conventional
Create a Home Valuation Report for This Property
The Home Valuation Report is an in-depth analysis detailing your home's value as well as a comparison with similar homes in the area
Home Values in the Area
Average Home Value in this Area
Purchase History
| Date | Buyer | Sale Price | Title Company |
|---|---|---|---|
| Cra Real Estate Llc | $68,080 | None Listed On Document | |
| Bank United Na | $104,723 | -- | |
| Skeels Gerald W | -- | None Available | |
| Yates Amber | -- | None Available |
Source: Public Records
Mortgage History
| Date | Status | Borrower | Loan Amount |
|---|---|---|---|
| Previous Owner | Skeels Gerald W | $103,123 | |
| Previous Owner | Yates Amber | $98,000 |
Source: Public Records
Tax History Compared to Growth
Tax History
| Year | Tax Paid | Tax Assessment Tax Assessment Total Assessment is a certain percentage of the fair market value that is determined by local assessors to be the total taxable value of land and additions on the property. | Land | Improvement |
|---|---|---|---|---|
| 2024 | $2,300 | $106,600 | $11,200 | $95,400 |
| 2023 | $2,261 | $104,100 | $11,200 | $92,900 |
| 2022 | $2,195 | $100,500 | $11,200 | $89,300 |
| 2021 | $2,056 | $92,500 | $11,200 | $81,300 |
| 2020 | $2,296 | $95,300 | $11,200 | $84,100 |
| 2019 | $351 | $95,800 | $11,200 | $84,600 |
| 2018 | $344 | $95,900 | $11,200 | $84,700 |
| 2017 | $338 | $95,100 | $11,200 | $83,900 |
| 2016 | $331 | $95,700 | $11,200 | $84,500 |
| 2014 | $318 | $93,100 | $11,200 | $81,900 |
| 2013 | -- | $90,700 | $11,200 | $79,500 |
Source: Public Records
Map
Nearby Homes
- 1321 Cumberland Ave
- 2937 Broadway Ave
- 1419 Cumberland Ave
- 1604 Ewing Ave
- 1629 Ewing Ave
- 1508 Cumberland Ave
- 1614 Hollywood Ave
- 2836 Dennison St
- 3453 Koressel Ave
- 3418 Koressel Ave
- 722 S Barker Ave
- 3301 Austin Ave
- 1825 S Bosse Ave
- 3114 Marion Ave
- 2721 Hartmetz Ave
- 2721 Marion Ave
- 408 S Elm Ave
- 210 Leslie Ave
- 380 Sorenson Ave
- 2820 Hillcrest Terrace
- 3140 Arlington Ave
- 3138 Arlington Ave
- 3136 Arlington Ave
- 1318 Stinson Ave
- 1307 Stinson Ave
- 1311 Stinson Ave
- 1303 Stinson Ave
- 1313 Stinson Ave
- 1301 Stinson Ave
- 3134 Arlington Ave
- 1227 Stinson Ave
- 1319 Stinson Ave
- 3143 Arlington Ave
- 3139 Broadway Ave
- 1225 Stinson Ave
- 3159 Broadway Ave
- 3135 Broadway Ave
- 3137 Arlington Ave
- 1221 Stinson Ave
- 3130 Arlington Ave