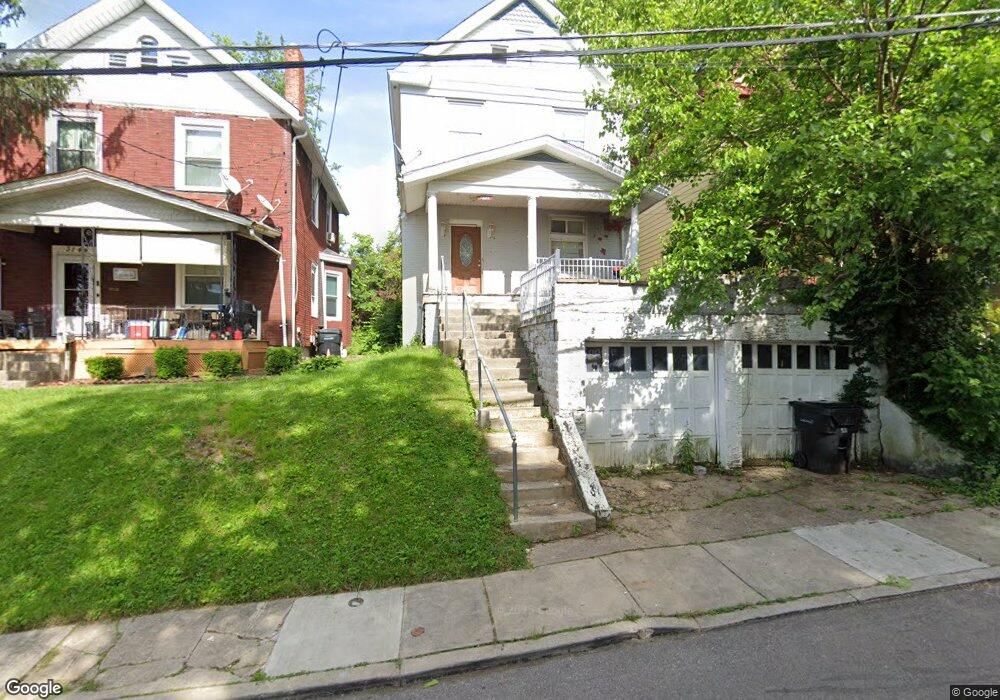
3142 Harvard Ave Cincinnati, OH 45207
Evanston NeighborhoodEstimated Value: $158,307 - $191,000
5
Beds
2
Baths
1,678
Sq Ft
$105/Sq Ft
Est. Value
About This Home
This home is located at 3142 Harvard Ave, Cincinnati, OH 45207 and is currently estimated at $176,327, approximately $105 per square foot. 3142 Harvard Ave is a home located in Hamilton County with nearby schools including Evanston Academy Elementary School, Clark Montessori High School, and Robert A. Taft Information Technology High School.
Ownership History
Date
Name
Owned For
Owner Type
Purchase Details
Closed on
Mar 4, 2025
Sold by
Davis Terrance
Bought by
Ceod Properties I Llc
Current Estimated Value
Purchase Details
Closed on
Feb 27, 2025
Sold by
Z Mckinney Trust and Mckinney Zakia
Bought by
Davis Terrance
Purchase Details
Closed on
Feb 9, 2012
Sold by
Davis Terrance J and Davis Laverne B
Bought by
Davis Terrance J
Purchase Details
Closed on
Jan 6, 2010
Sold by
Davis Terrance J
Bought by
Davis Terrance J and Davis Laverne B
Purchase Details
Closed on
Apr 14, 2006
Sold by
Davis Terrance and Davis Laverne
Bought by
The Z Mckinney Trust
Purchase Details
Closed on
Apr 27, 2004
Sold by
Hall Alene and Hall Annie
Bought by
Davis Terrance J
Create a Home Valuation Report for This Property
The Home Valuation Report is an in-depth analysis detailing your home's value as well as a comparison with similar homes in the area
Home Values in the Area
Average Home Value in this Area
Purchase History
| Date | Buyer | Sale Price | Title Company |
|---|---|---|---|
| Ceod Properties I Llc | -- | None Listed On Document | |
| Ceod Properties I Llc | -- | None Listed On Document | |
| Davis Terrance | -- | None Listed On Document | |
| Davis Terrance | -- | None Listed On Document | |
| Davis Terrance J | -- | None Available | |
| Davis Terrance J | -- | Attorney | |
| The Z Mckinney Trust | -- | Attorney | |
| Davis Terrance J | $15,100 | -- |
Source: Public Records
Tax History
| Year | Tax Paid | Tax Assessment Tax Assessment Total Assessment is a certain percentage of the fair market value that is determined by local assessors to be the total taxable value of land and additions on the property. | Land | Improvement |
|---|---|---|---|---|
| 2025 | $1,573 | $22,750 | $4,627 | $18,123 |
| 2024 | $1,571 | $22,750 | $4,627 | $18,123 |
| 2023 | $2,650 | $39,750 | $4,627 | $35,123 |
| 2022 | $778 | $9,156 | $3,360 | $5,796 |
| 2021 | $641 | $9,156 | $3,360 | $5,796 |
| 2020 | $643 | $9,156 | $3,360 | $5,796 |
| 2019 | $647 | $8,401 | $3,084 | $5,317 |
| 2018 | $648 | $8,401 | $3,084 | $5,317 |
| 2017 | $1,180 | $15,971 | $3,084 | $12,887 |
| 2016 | $534 | $7,000 | $3,346 | $3,654 |
| 2015 | $457 | $7,000 | $3,346 | $3,654 |
| 2014 | $1,164 | $17,903 | $3,346 | $14,557 |
| 2013 | $1,207 | $18,267 | $3,413 | $14,854 |
Source: Public Records
Map
Nearby Homes
- 3238 Gilbert Ave
- 3217 Gilbert Ave
- 3138 Woodburn Ave
- 3206 Gilbert Ave
- 1541 Merrimac St
- 1521 Merrimac St
- 3129 Hackberry St
- 1517 Saint Leger Place
- 1534 Dixmont Ave
- 3121 Hackberry St
- 3119 Hackberry St
- 1613 Dexter Ave
- 1623 Dexter Ave
- 1628 Dexter Ave
- 1506 Dixmont Ave
- 3120 Hackberry St
- 1723 Kinney Ave
- 1521 Blair Ave
- 1627 Everly Place
- 3311 Fairfield Ave
- 3138 Harvard Ave
- 3144 Harvard Ave
- 3148 Harvard Ave
- 3132 Harvard Ave
- 3152 Harvard Ave
- 3137 Harvard Ave
- 3215 Woodburn Ave
- 3234 Gilbert Ave
- 3135 Harvard Ave
- 3133 Harvard Ave
- 3126 Harvard Ave
- 3232 Gilbert Ave
- 3240 Gilbert Ave
- 3131 Harvard Ave
- 3124 Harvard Ave
- 3129 Harvard Ave
- 3223 Woodburn Ave
- 3228 Gilbert Ave
- 3127 Harvard Ave
- 3122 Harvard Ave
Your Personal Tour Guide
Ask me questions while you tour the home.