Estimated Value: $227,000 - $269,000
--
Bed
2
Baths
1,566
Sq Ft
$160/Sq Ft
Est. Value
About This Home
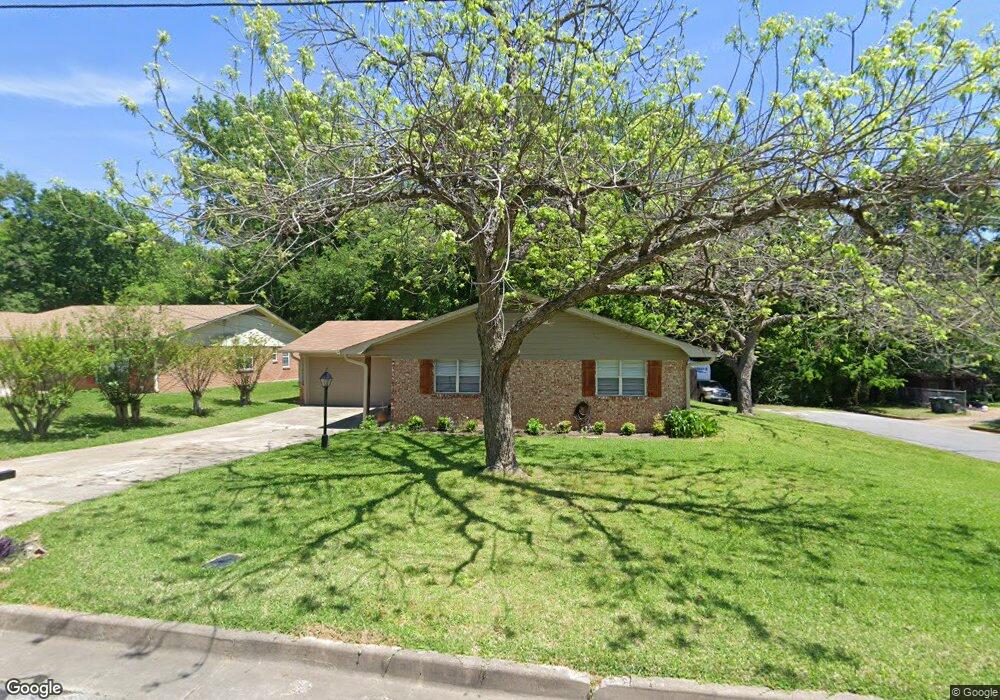
This home is located at 3142 Rosemary Ln, Tyler, TX 75701 and is currently estimated at $250,192, approximately $159 per square foot. 3142 Rosemary Ln is a home located in Smith County with nearby schools including Clarkston Elementary School, Hubbard Middle School, and Tyler Legacy High School.
Ownership History
Date
Name
Owned For
Owner Type
Purchase Details
Closed on
Dec 29, 2023
Sold by
Moser Dennis J
Bought by
Moser Dennis J
Current Estimated Value
Purchase Details
Closed on
Oct 9, 2023
Sold by
Moser Linda J
Bought by
Moser Linda J
Purchase Details
Closed on
May 13, 2021
Sold by
Stine Jerry D and Stine Domietha P
Bought by
Moser Dennis J and Moser Linda J
Purchase Details
Closed on
Feb 12, 2021
Sold by
England John William
Bought by
Stine Jerry D and Stine Domiethia P
Home Financials for this Owner
Home Financials are based on the most recent Mortgage that was taken out on this home.
Original Mortgage
$144,708
Interest Rate
2.7%
Mortgage Type
Commercial
Purchase Details
Closed on
May 14, 2012
Sold by
Caton Betty
Bought by
England John William
Purchase Details
Closed on
Aug 16, 2005
Sold by
Campbell Jack G and Campbell Anne Barclay
Bought by
England Durene
Create a Home Valuation Report for This Property
The Home Valuation Report is an in-depth analysis detailing your home's value as well as a comparison with similar homes in the area
Home Values in the Area
Average Home Value in this Area
Purchase History
| Date | Buyer | Sale Price | Title Company |
|---|---|---|---|
| Moser Dennis J | -- | None Listed On Document | |
| Moser Linda J | -- | None Listed On Document | |
| Moser Dennis J | -- | None Available | |
| Stine Jerry D | -- | None Available | |
| England John William | -- | None Available | |
| England Durene | -- | Fa |
Source: Public Records
Mortgage History
| Date | Status | Borrower | Loan Amount |
|---|---|---|---|
| Previous Owner | Stine Jerry D | $144,708 |
Source: Public Records
Tax History Compared to Growth
Tax History
| Year | Tax Paid | Tax Assessment Tax Assessment Total Assessment is a certain percentage of the fair market value that is determined by local assessors to be the total taxable value of land and additions on the property. | Land | Improvement |
|---|---|---|---|---|
| 2025 | $2,102 | $234,878 | $30,874 | $204,004 |
| 2024 | $2,102 | $227,949 | $21,330 | $206,619 |
| 2023 | $3,717 | $248,789 | $21,330 | $227,459 |
| 2022 | $3,798 | $193,852 | $21,330 | $172,522 |
| 2021 | $2,878 | $137,161 | $21,330 | $115,831 |
| 2020 | $2,916 | $136,282 | $21,330 | $114,952 |
| 2019 | $2,913 | $133,215 | $18,960 | $114,255 |
| 2018 | $2,695 | $123,911 | $16,235 | $107,676 |
| 2017 | $2,645 | $123,911 | $16,235 | $107,676 |
| 2016 | $2,560 | $119,906 | $16,235 | $103,671 |
| 2015 | $2,459 | $119,081 | $16,235 | $102,846 |
| 2014 | $2,459 | $115,720 | $16,235 | $99,485 |
Source: Public Records
Map
Nearby Homes
- 2827 Fairfax Dr
- 2631 Amy Ln
- 2902 Shenandoah Dr
- 3109 Campus Cir
- 2958 Calloway Rd
- 2716 Roanoke Ln
- 3108 Williamsburg Cir
- 2512 Alta Mira Dr
- 3107 Lake Vista Cir
- 2523 Shenandoah Dr
- 3801 Old Troup Hwy
- 2417 Riviera Dr
- 2830 Juniper Ln
- 2509 Delmar Dr
- 3621 Rock Creek Dr
- 3308 Moss Glen
- 1920 McDonald Rd
- 3401 Omega Dr
- 2909 Meadowlark Ln
- 4004 Lazy Creek Dr
- 3136 Rosemary Ln
- 3130 Rosemary Ln
- 3148 Rosemary Ln
- 3139 3139 Rosemary
- 3139 Rosemary Ln
- 3147 Shenandoah Dr
- 3124 Rosemary Ln
- 3124 3124 Rosemary
- 3202 Rosemary Ln
- 3131 3131 Rosemary
- 3131 Rosemary Ln
- 2901 Emily Ln
- 3201 Shenandoah Dr
- 3125 Rosemary Ln
- 2844 2844 Emily
- 2844 Emily Ln
- 3118 Rosemary Ln
- 3208 3208 Rosemary
- 3208 Rosemary Ln
- 3119 Rosemary Ln