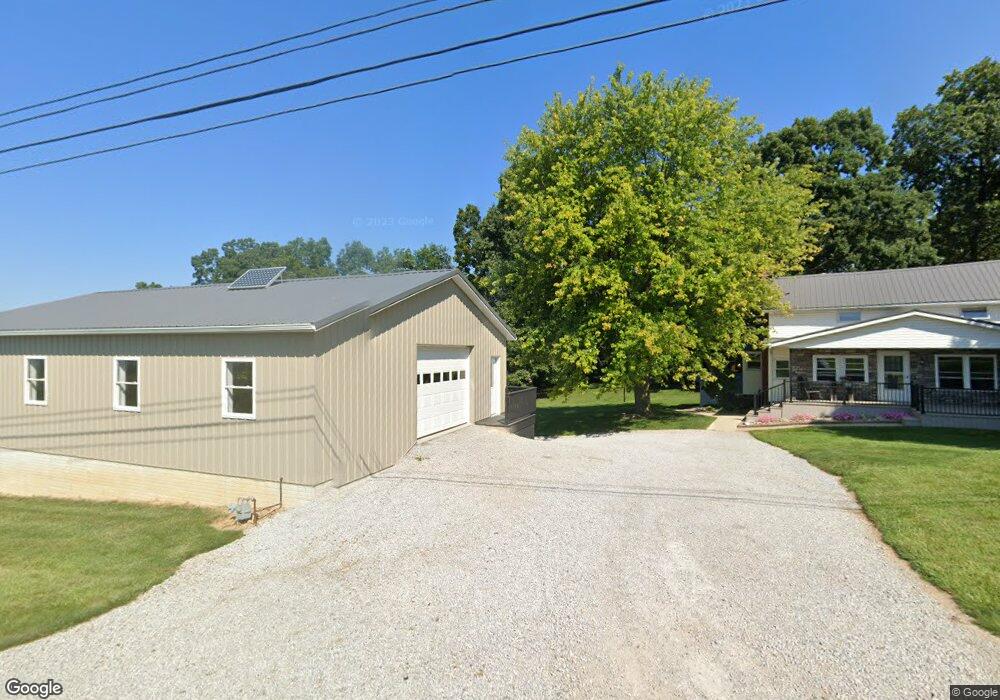
3144 Harrison Rd Fredericksburg, OH 44627
Estimated Value: $294,000 - $458,000
5
Beds
2
Baths
3,216
Sq Ft
$117/Sq Ft
Est. Value
About This Home
This home is located at 3144 Harrison Rd, Fredericksburg, OH 44627 and is currently estimated at $376,060, approximately $116 per square foot. 3144 Harrison Rd is a home located in Wayne County with nearby schools including Waynedale High School, MEADOW SPRINGS, and Ridge View.
Ownership History
Date
Name
Owned For
Owner Type
Purchase Details
Closed on
Dec 16, 2022
Sold by
Mast Martin J and Mast Susan M
Bought by
Nisley Andrew A and Nisley Laura A
Current Estimated Value
Purchase Details
Closed on
Dec 5, 2022
Sold by
Mast Martin J and Mast Susan M
Bought by
Mast Martin and Mast Susan
Purchase Details
Closed on
Aug 13, 2021
Sold by
Wengerd Alvin J
Bought by
Mast Martin J and Wengerd Betty A
Home Financials for this Owner
Home Financials are based on the most recent Mortgage that was taken out on this home.
Original Mortgage
$100,000
Interest Rate
2.8%
Mortgage Type
Credit Line Revolving
Purchase Details
Closed on
Apr 5, 2012
Sold by
Wengerd Alvin J and Wengerd Betty A
Bought by
Mast Martin J and Mast Susan M
Purchase Details
Closed on
Aug 21, 1986
Bought by
Wengerd Alvin J and Wengerd Betty A
Create a Home Valuation Report for This Property
The Home Valuation Report is an in-depth analysis detailing your home's value as well as a comparison with similar homes in the area
Home Values in the Area
Average Home Value in this Area
Purchase History
| Date | Buyer | Sale Price | Title Company |
|---|---|---|---|
| Nisley Andrew A | -- | -- | |
| Mast Martin | -- | -- | |
| Mast Martin | -- | -- | |
| Mast Martin | -- | None Listed On Document | |
| Mast Martin J | -- | None Available | |
| Mast Martin J | $145,000 | Attorney | |
| Wengerd Alvin J | -- | -- |
Source: Public Records
Mortgage History
| Date | Status | Borrower | Loan Amount |
|---|---|---|---|
| Previous Owner | Mast Martin J | $100,000 |
Source: Public Records
Tax History Compared to Growth
Tax History
| Year | Tax Paid | Tax Assessment Tax Assessment Total Assessment is a certain percentage of the fair market value that is determined by local assessors to be the total taxable value of land and additions on the property. | Land | Improvement |
|---|---|---|---|---|
| 2024 | $3,970 | $138,300 | $45,580 | $92,720 |
| 2023 | $3,970 | $138,300 | $45,580 | $92,720 |
| 2022 | $4,283 | $116,660 | $23,940 | $92,720 |
| 2021 | $4,293 | $116,660 | $23,940 | $92,720 |
| 2020 | $4,343 | $116,660 | $23,940 | $92,720 |
| 2019 | $3,096 | $84,040 | $19,440 | $64,600 |
| 2018 | $3,221 | $84,040 | $19,440 | $64,600 |
| 2017 | $2,600 | $70,470 | $19,440 | $51,030 |
| 2016 | $2,565 | $67,110 | $18,510 | $48,600 |
| 2015 | $2,532 | $67,110 | $18,510 | $48,600 |
| 2014 | $2,546 | $67,110 | $18,510 | $48,600 |
| 2013 | $2,628 | $68,580 | $17,950 | $50,630 |
Source: Public Records
Map
Nearby Homes
- 591 N Mill St Unit B
- 591 N Mill St Unit D
- 591 N Mill St
- 591 N Mill St Unit C
- 591 N Mill St Unit A
- 7904 Hoy Rd
- 4554 E Moreland Rd
- 6424 S Honeytown Rd
- 8276 Harrison Rd
- 9675 Harrison Rd
- 10840 County Road 1
- 4622 S Apple Creek Rd
- 286 E Robinson St
- 292 E Mcconkey St
- 0 E Main St
- 283 E Wood St
- 236 Jones St
- 3979 Batdorf Rd
- 270 Church St
- 24 Shannon Dr
- 10169 Nonpariel Rd
- 2980 Harrison Rd
- 3344 Harrison Rd
- 3344 Harrison Rd
- 10131 Nonpariel Rd
- 2901 Harrison Rd
- 2840 Harrison Rd
- 3510 Harrison Rd
- 2756 Harrison Rd
- 2767 Harrison Rd
- 2888 Harrison Rd
- 2736 Harrison Rd
- 2721 Harrison Rd
- 2868 Harrison Rd
- 2848 Harrison Rd
- 2686 Harrison Rd
- 2666 Harrison Rd
- 11257 Redett Rd
- 3758 Harrison Rd
- 2557 Harrison Rd