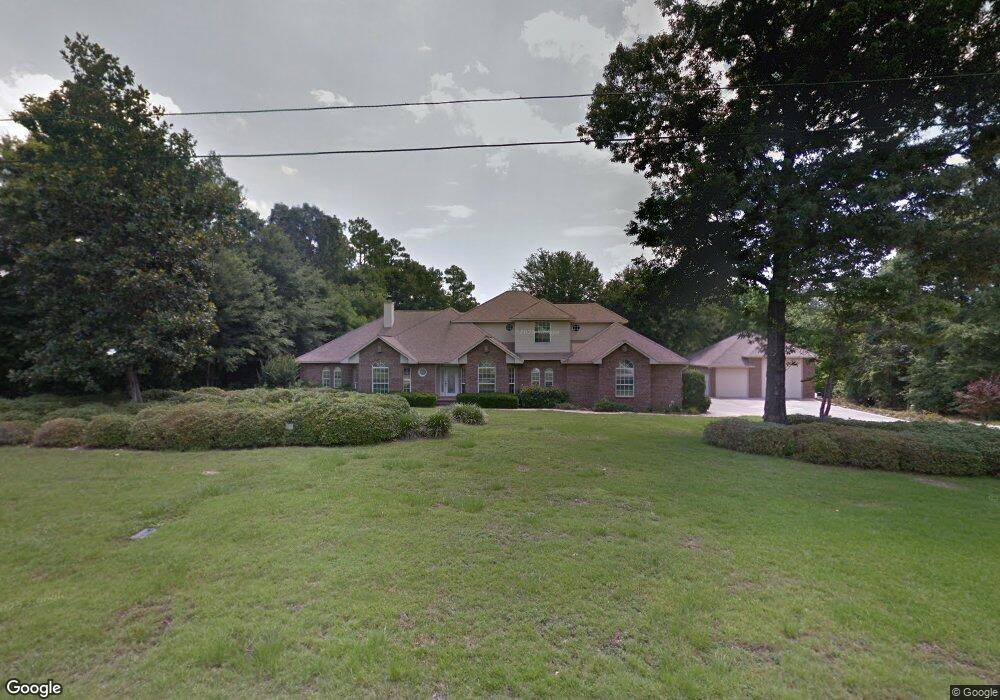
3144 Sonya St Milton, FL 32571
Estimated Value: $698,000 - $870,628
4
Beds
5
Baths
3,679
Sq Ft
$218/Sq Ft
Est. Value
About This Home
This home is located at 3144 Sonya St, Milton, FL 32571 and is currently estimated at $802,157, approximately $218 per square foot. 3144 Sonya St is a home located in Santa Rosa County with nearby schools including S.S. Dixon Primary School, S.S. Dixon Intermediate School, and Thomas L. Sims Middle School.
Ownership History
Date
Name
Owned For
Owner Type
Purchase Details
Closed on
Jun 30, 2021
Sold by
Marker Jeffrey L and Marker Donna J
Bought by
Harrod Brian T and Harrod Rachel Grace
Current Estimated Value
Purchase Details
Closed on
Sep 29, 1994
Sold by
Pullum William A and Walton Garrett W
Bought by
Marker Jeffrey L and Marker Donna J
Home Financials for this Owner
Home Financials are based on the most recent Mortgage that was taken out on this home.
Original Mortgage
$175,000
Interest Rate
7.99%
Create a Home Valuation Report for This Property
The Home Valuation Report is an in-depth analysis detailing your home's value as well as a comparison with similar homes in the area
Home Values in the Area
Average Home Value in this Area
Purchase History
| Date | Buyer | Sale Price | Title Company |
|---|---|---|---|
| Harrod Brian T | $750,000 | Attorney | |
| Marker Jeffrey L | -- | -- |
Source: Public Records
Mortgage History
| Date | Status | Borrower | Loan Amount |
|---|---|---|---|
| Previous Owner | Marker Jeffrey L | $175,000 |
Source: Public Records
Tax History Compared to Growth
Tax History
| Year | Tax Paid | Tax Assessment Tax Assessment Total Assessment is a certain percentage of the fair market value that is determined by local assessors to be the total taxable value of land and additions on the property. | Land | Improvement |
|---|---|---|---|---|
| 2024 | $5,823 | $498,813 | -- | -- |
| 2023 | $5,823 | $484,284 | $0 | $0 |
| 2022 | $5,690 | $470,179 | $0 | $0 |
| 2021 | $4,481 | $370,785 | $0 | $0 |
| 2020 | $4,462 | $365,666 | $0 | $0 |
| 2019 | $4,364 | $357,445 | $0 | $0 |
| 2018 | $4,051 | $350,780 | $0 | $0 |
| 2017 | $4,072 | $343,565 | $0 | $0 |
| 2016 | $4,069 | $336,499 | $0 | $0 |
| 2015 | $4,255 | $334,160 | $0 | $0 |
| 2014 | $4,305 | $331,508 | $0 | $0 |
Source: Public Records
Map
Nearby Homes