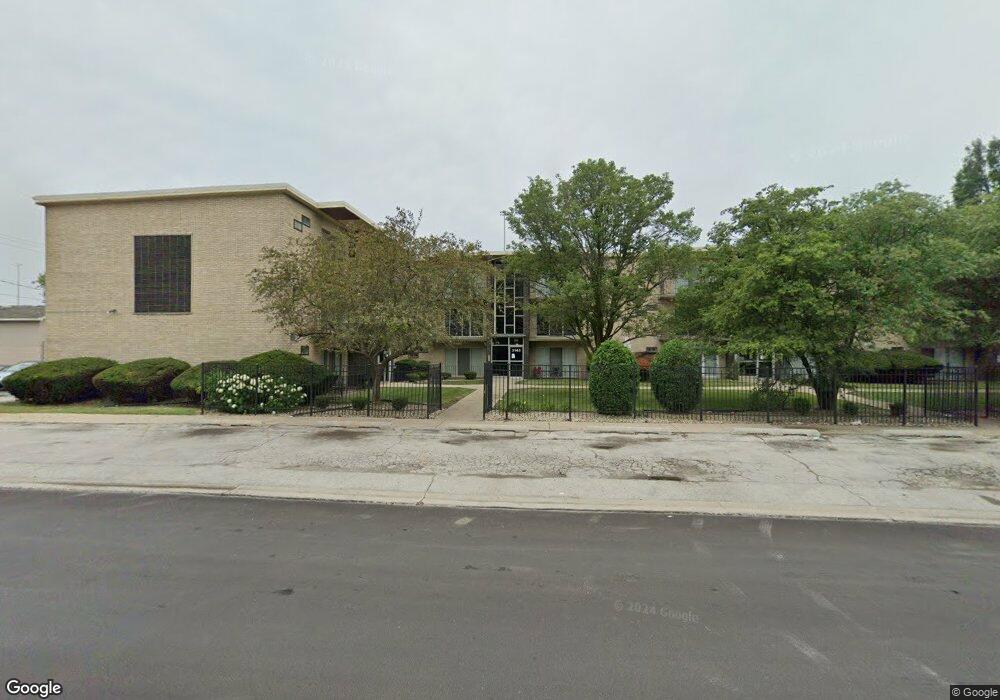
3145 Bernice Rd Unit 31451 Lansing, IL 60438
Estimated Value: $72,000 - $92,000
2
Beds
1
Bath
672
Sq Ft
$116/Sq Ft
Est. Value
About This Home
This home is located at 3145 Bernice Rd Unit 31451, Lansing, IL 60438 and is currently estimated at $77,775, approximately $115 per square foot. 3145 Bernice Rd Unit 31451 is a home located in Cook County with nearby schools including Reavis Elementary School, Memorial Jr High School, and Thornton Fractnl So High School.
Ownership History
Date
Name
Owned For
Owner Type
Purchase Details
Closed on
Jun 14, 2022
Sold by
Rayford Telly
Bought by
Bernice Lansing 2 Land Trust
Current Estimated Value
Purchase Details
Closed on
Aug 8, 2019
Sold by
Crosstown Builders Inc
Bought by
Rayford Telly
Purchase Details
Closed on
Jun 22, 2016
Sold by
Secretary Of Hud
Bought by
Fischer Real Estate Sales And Consulting and Wc Investments Inc
Purchase Details
Closed on
Aug 28, 2013
Sold by
Varichak Guadalupe A
Bought by
The Secretary Of Housing & Urban Develop
Purchase Details
Closed on
Aug 14, 1998
Sold by
Ncc Bernice Terraces Llc
Bought by
Torres Guadalupe A
Home Financials for this Owner
Home Financials are based on the most recent Mortgage that was taken out on this home.
Original Mortgage
$58,650
Interest Rate
7.03%
Create a Home Valuation Report for This Property
The Home Valuation Report is an in-depth analysis detailing your home's value as well as a comparison with similar homes in the area
Home Values in the Area
Average Home Value in this Area
Purchase History
| Date | Buyer | Sale Price | Title Company |
|---|---|---|---|
| Bernice Lansing 2 Land Trust | $65,000 | None Listed On Document | |
| Rayford Telly | $51,000 | Fidelity National Title | |
| Fischer Real Estate Sales And Consulting | -- | Fidelity National Title | |
| The Secretary Of Housing & Urban Develop | -- | Attorney | |
| Torres Guadalupe A | $60,000 | -- |
Source: Public Records
Mortgage History
| Date | Status | Borrower | Loan Amount |
|---|---|---|---|
| Previous Owner | Torres Guadalupe A | $58,650 |
Source: Public Records
Tax History Compared to Growth
Tax History
| Year | Tax Paid | Tax Assessment Tax Assessment Total Assessment is a certain percentage of the fair market value that is determined by local assessors to be the total taxable value of land and additions on the property. | Land | Improvement |
|---|---|---|---|---|
| 2024 | $2,903 | $6,001 | $427 | $5,574 |
| 2023 | $2,080 | $6,001 | $427 | $5,574 |
| 2022 | $2,080 | $3,202 | $587 | $2,615 |
| 2021 | $2,024 | $3,201 | $586 | $2,615 |
| 2020 | $1,464 | $3,201 | $586 | $2,615 |
| 2019 | $1,492 | $2,620 | $533 | $2,087 |
| 2018 | $1,464 | $2,620 | $533 | $2,087 |
| 2017 | $1,848 | $3,275 | $533 | $2,742 |
| 2016 | $1,014 | $4,351 | $480 | $3,871 |
| 2015 | $1,589 | $5,751 | $480 | $5,271 |
| 2014 | $1,595 | $5,751 | $480 | $5,271 |
| 2013 | $738 | $4,268 | $480 | $3,788 |
Source: Public Records
Map
Nearby Homes
- 17318 Walter St
- 3026 Bernice Rd Unit 308
- 3253 Bernice Rd
- 17256 Walter St
- 3425 Bernice Ave
- 17518 Roy St
- 17317 Roy St
- 17303 Chicago Ave
- 2950 Bernice Rd
- 17303 Roy St
- 17552 Roy St
- 17335 Community St
- 17331 Community St
- 3347 Bernice Rd
- 17218 Park Ave
- 17519 Community St
- 17226 Community St
- 17157 Walter St
- 17153 Walter St
- 17641 Burnham Ave
- 3145 Bernice Rd Unit 31456
- 3145 Bernice Rd Unit 31454
- 3145 Bernice Rd Unit 31455
- 3145 Bernice Ave Unit 6
- 3145 Bernice Rd Unit 6
- 3145 Bernice Ave Unit 3
- 3145 Bernice Rd Unit 2
- 3145 Bernice Rd Unit 1
- 3145 Bernice Rd
- 3145 Bernice Rd Unit 5
- 3133 Bernice Rd Unit 31332
- 3133 Bernice Rd Unit 31333
- 3133 Bernice Rd Unit 31334
- 3133 Bernice Rd Unit 31336
- 3133 Bernice Rd Unit 4
- 3133 Bernice Rd Unit 1
- 3133 Bernice Rd Unit 5
- 3133 Bernice Rd Unit 2
- 3133 Bernice Rd
- 3133 Bernice Rd Unit 6