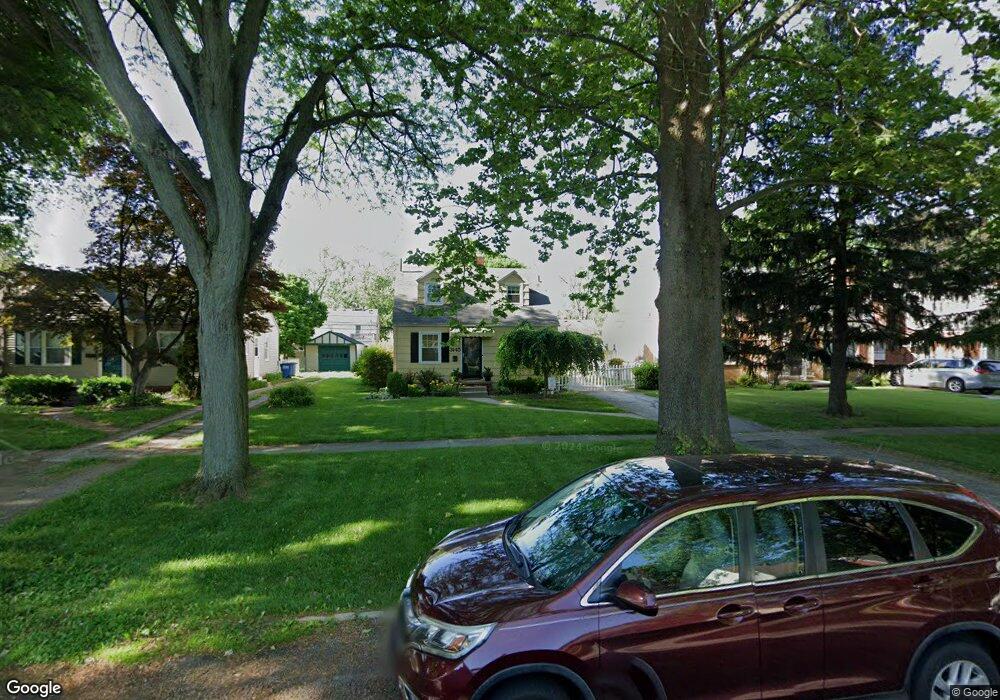
3145 Heatherdowns Blvd Toledo, OH 43614
Glendale-Heatherdowns NeighborhoodEstimated Value: $168,798 - $174,000
3
Beds
2
Baths
1,287
Sq Ft
$133/Sq Ft
Est. Value
About This Home
This home is located at 3145 Heatherdowns Blvd, Toledo, OH 43614 and is currently estimated at $171,200, approximately $133 per square foot. 3145 Heatherdowns Blvd is a home located in Lucas County with nearby schools including Byrnedale Elementary School, Bowsher High School, and St. Patrick of Heatherdowns School.
Ownership History
Date
Name
Owned For
Owner Type
Purchase Details
Closed on
Sep 5, 2003
Sold by
Hegazy Mohammed and Hegazy Shadia Nada
Bought by
Garand Nancy C
Current Estimated Value
Home Financials for this Owner
Home Financials are based on the most recent Mortgage that was taken out on this home.
Original Mortgage
$112,610
Outstanding Balance
$51,268
Interest Rate
5.97%
Mortgage Type
FHA
Estimated Equity
$119,932
Purchase Details
Closed on
Jan 2, 1998
Sold by
Contat Debra L
Bought by
Hegazy Mohammed and Hegazy Shadia Nada
Home Financials for this Owner
Home Financials are based on the most recent Mortgage that was taken out on this home.
Original Mortgage
$64,000
Interest Rate
7.28%
Purchase Details
Closed on
Nov 1, 1996
Sold by
Bechtel Susan L
Bought by
Contat Debra L
Home Financials for this Owner
Home Financials are based on the most recent Mortgage that was taken out on this home.
Original Mortgage
$78,300
Interest Rate
8.23%
Mortgage Type
New Conventional
Purchase Details
Closed on
Oct 12, 1989
Sold by
Garn J A and P A
Create a Home Valuation Report for This Property
The Home Valuation Report is an in-depth analysis detailing your home's value as well as a comparison with similar homes in the area
Home Values in the Area
Average Home Value in this Area
Purchase History
| Date | Buyer | Sale Price | Title Company |
|---|---|---|---|
| Garand Nancy C | $113,500 | -- | |
| Hegazy Mohammed | $88,000 | Louisville Title Agency For | |
| Contat Debra L | $87,200 | -- | |
| -- | $62,500 | -- |
Source: Public Records
Mortgage History
| Date | Status | Borrower | Loan Amount |
|---|---|---|---|
| Open | Garand Nancy C | $112,610 | |
| Previous Owner | Hegazy Mohammed | $64,000 | |
| Previous Owner | Contat Debra L | $78,300 |
Source: Public Records
Tax History Compared to Growth
Tax History
| Year | Tax Paid | Tax Assessment Tax Assessment Total Assessment is a certain percentage of the fair market value that is determined by local assessors to be the total taxable value of land and additions on the property. | Land | Improvement |
|---|---|---|---|---|
| 2024 | $1,210 | $38,955 | $8,855 | $30,100 |
| 2023 | $2,354 | $36,435 | $8,400 | $28,035 |
| 2022 | $2,340 | $36,435 | $8,400 | $28,035 |
| 2021 | $2,414 | $36,435 | $8,400 | $28,035 |
| 2020 | $2,261 | $29,890 | $6,895 | $22,995 |
| 2019 | $2,193 | $29,890 | $6,895 | $22,995 |
| 2018 | $2,193 | $29,890 | $6,895 | $22,995 |
| 2017 | $2,235 | $29,225 | $6,755 | $22,470 |
| 2016 | $2,231 | $83,500 | $19,300 | $64,200 |
| 2015 | $2,232 | $83,500 | $19,300 | $64,200 |
| 2014 | $1,839 | $29,230 | $6,760 | $22,470 |
| 2013 | $1,839 | $29,230 | $6,760 | $22,470 |
Source: Public Records
Map
Nearby Homes
- 3157 Strathmoor Ave
- 1848 Brierheath Ave
- 3133 Glencairn Ave
- 3148 Glanzman Rd
- 3118 Muirfield Ave
- 2134 Tedrow Rd
- 3042 Schneider Rd
- 1912 Glencairn Ave
- 1926 Meadowlark Ave
- 1629 Carmelle Ct
- 2921 Schneider Rd
- 1553 Charmaine Dr
- 1970 Cherrylawn Dr
- 1953 Heatherlawn Dr
- 2651 Tully Ave
- 3619 Prairie Ave
- 2930 S Byrne Rd
- 1919 Colony Dr
- 3626 Greenlawn Ct
- 3679 Elmlawn Dr
- 3141 Heatherdowns Blvd
- 3151 Heatherdowns Blvd
- 3135 Heatherdowns Blvd
- 3155 Heatherdowns Blvd
- 3150 Winston Blvd
- 3158 Winston Blvd
- 3148 Winston Blvd
- 3131 Heatherdowns Blvd
- 3162 Winston Blvd
- 3142 Winston Blvd
- 3138 Winston Blvd
- 3125 Heatherdowns Blvd
- 3203 Heatherdowns Blvd
- 3148 Heatherdowns Blvd
- 3144 Heatherdowns Blvd
- 3154 Heatherdowns Blvd
- 3138 Heatherdowns Blvd
- 3158 Heatherdowns Blvd
- 3121 Heatherdowns Blvd
- 3134 Heatherdowns Blvd