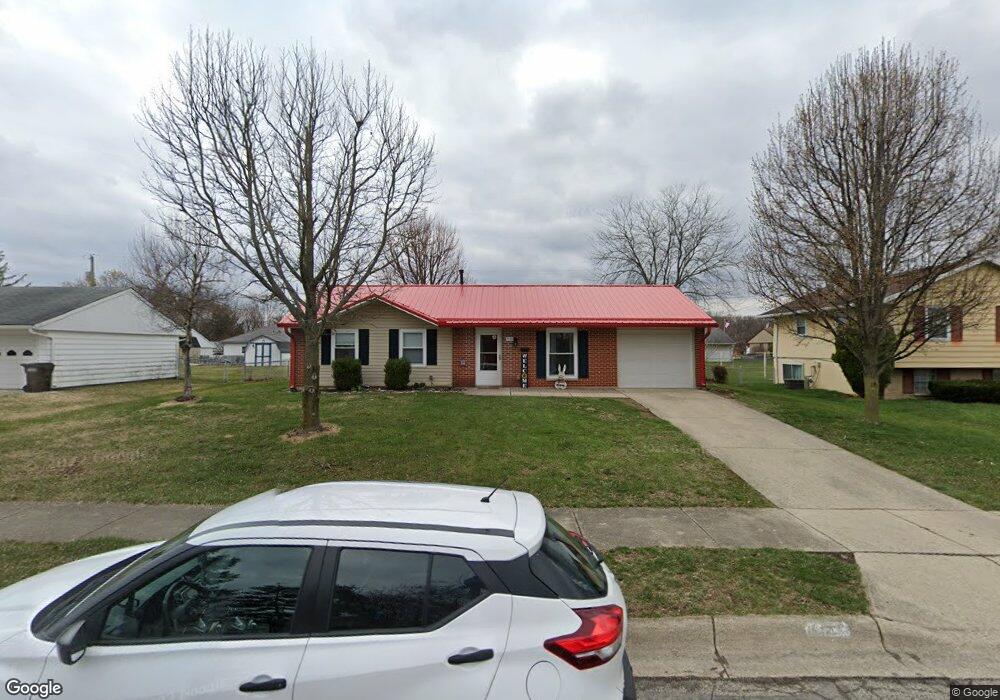
3145 Nantucket St Springfield, OH 45503
Estimated Value: $165,000 - $189,000
3
Beds
1
Bath
950
Sq Ft
$188/Sq Ft
Est. Value
About This Home
This home is located at 3145 Nantucket St, Springfield, OH 45503 and is currently estimated at $178,631, approximately $188 per square foot. 3145 Nantucket St is a home located in Clark County with nearby schools including Kenton Elementary School, Roosevelt Middle School, and Springfield High School.
Ownership History
Date
Name
Owned For
Owner Type
Purchase Details
Closed on
Apr 15, 2015
Sold by
Earley Amanda L and Earley Joseph A
Bought by
Ewers Ron and Ewers Jan M
Current Estimated Value
Home Financials for this Owner
Home Financials are based on the most recent Mortgage that was taken out on this home.
Original Mortgage
$74,481
Outstanding Balance
$57,070
Interest Rate
3.85%
Mortgage Type
FHA
Estimated Equity
$121,561
Purchase Details
Closed on
Mar 26, 2010
Sold by
Niclin Group Llc
Bought by
Earley Joseph A and Durrette Amanda L
Home Financials for this Owner
Home Financials are based on the most recent Mortgage that was taken out on this home.
Original Mortgage
$81,397
Interest Rate
4.96%
Mortgage Type
FHA
Purchase Details
Closed on
Dec 1, 2009
Sold by
Household Realty Corporation
Bought by
Niclin Group Llc
Purchase Details
Closed on
Jun 18, 2009
Sold by
Fenwick Roger A
Bought by
Household Realty Corporation
Purchase Details
Closed on
May 29, 2002
Sold by
Straley Larry L and Straley Jean D
Bought by
Fenwick Roger A and Fenwick Karen L
Home Financials for this Owner
Home Financials are based on the most recent Mortgage that was taken out on this home.
Original Mortgage
$75,279
Interest Rate
7%
Mortgage Type
FHA
Create a Home Valuation Report for This Property
The Home Valuation Report is an in-depth analysis detailing your home's value as well as a comparison with similar homes in the area
Home Values in the Area
Average Home Value in this Area
Purchase History
| Date | Buyer | Sale Price | Title Company |
|---|---|---|---|
| Ewers Ron | $77,000 | Attorney | |
| Earley Joseph A | $82,900 | Team Title & Closing Service | |
| Niclin Group Llc | $51,600 | Team Title & Closing Service | |
| Household Realty Corporation | $46,700 | Attorney | |
| Fenwick Roger A | $76,000 | -- |
Source: Public Records
Mortgage History
| Date | Status | Borrower | Loan Amount |
|---|---|---|---|
| Open | Ewers Ron | $74,481 | |
| Previous Owner | Earley Joseph A | $81,397 | |
| Previous Owner | Fenwick Roger A | $75,279 |
Source: Public Records
Tax History
| Year | Tax Paid | Tax Assessment Tax Assessment Total Assessment is a certain percentage of the fair market value that is determined by local assessors to be the total taxable value of land and additions on the property. | Land | Improvement |
|---|---|---|---|---|
| 2025 | $1,510 | $55,700 | $8,390 | $47,310 |
| 2024 | $1,459 | $35,610 | $8,590 | $27,020 |
| 2023 | $1,459 | $35,610 | $8,590 | $27,020 |
| 2022 | $1,465 | $35,610 | $8,590 | $27,020 |
| 2021 | $1,385 | $28,890 | $6,660 | $22,230 |
| 2020 | $1,386 | $28,890 | $6,660 | $22,230 |
| 2019 | $1,414 | $28,890 | $6,660 | $22,230 |
| 2018 | $1,310 | $25,870 | $5,550 | $20,320 |
| 2017 | $1,113 | $27,934 | $5,551 | $22,383 |
| 2016 | $1,105 | $27,934 | $5,551 | $22,383 |
| 2015 | $1,278 | $27,934 | $5,551 | $22,383 |
| 2014 | $1,278 | $27,934 | $5,551 | $22,383 |
| 2013 | $1,275 | $27,934 | $5,551 | $22,383 |
Source: Public Records
Map
Nearby Homes
- 3214 Revels St
- 1924 Marinette Dr
- 1948 Falmouth Ave
- 3300 Revels St
- 2022 Westboro Ave
- 1516 Hyannis Dr
- 2043 Providence Ave
- 1811 Devon Dr
- 2529 Marinette Dr
- 1032 Armsgate Rd
- 1040 Carson Ln
- 1139 Bradford Dr
- 3124 El Camino Dr
- 2400 Thor Dr
- 1149 Foxboro Rd
- 1136 Foxboro Rd Unit 202
- 3126 Lakeview Ct Unit 3126
- 2861 Ashlar Dr
- 2553 Derr Rd
- 3135 Imperial Blvd
- 3137 Nantucket St
- 3153 Nantucket St
- 3154 Haverhill St
- 3138 Haverhill St
- 3201 Nantucket St
- 3129 Nantucket St
- 3146 Nantucket St
- 3200 Haverhill St
- 3120 Bristol Dr
- 3138 Nantucket St
- 3130 Haverhill St
- 3207 Nantucket St
- 3130 Nantucket St
- 3121 Nantucket St
- 3208 Haverhill St
- 3122 Haverhill St
- 3128 Bristol Dr
- 3122 Nantucket St
- 3145 Haverhill St
- 3215 Nantucket St
Your Personal Tour Guide
Ask me questions while you tour the home.