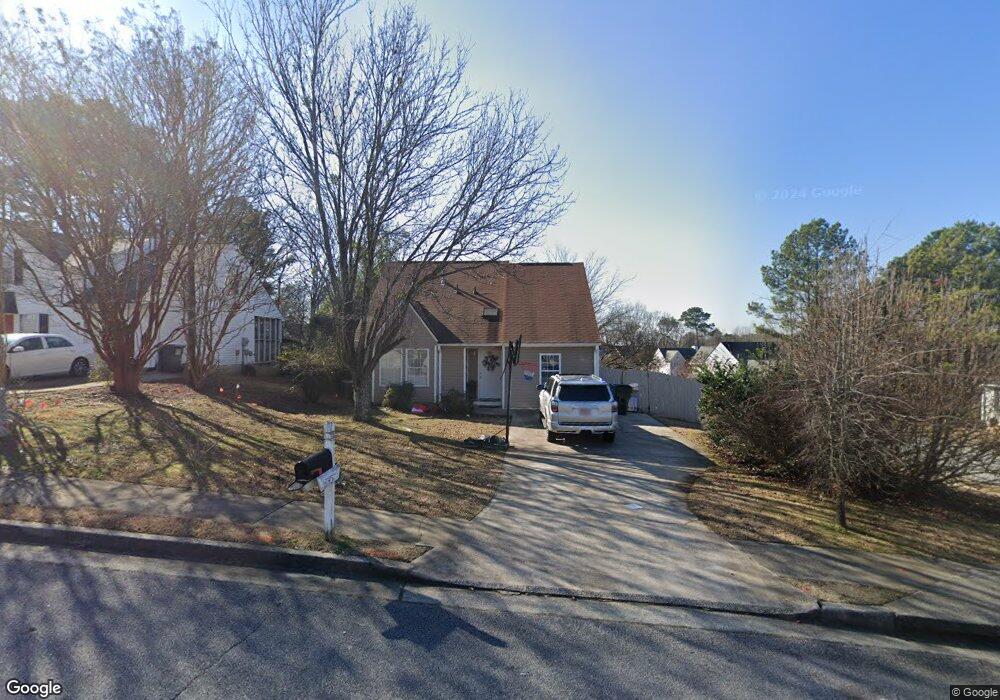
3145 W Point Cir Douglasville, GA 30135
Lithia Springs NeighborhoodEstimated Value: $230,790 - $258,000
3
Beds
2
Baths
1,205
Sq Ft
$199/Sq Ft
Est. Value
About This Home
This home is located at 3145 W Point Cir, Douglasville, GA 30135 and is currently estimated at $240,198, approximately $199 per square foot. 3145 W Point Cir is a home located in Douglas County with nearby schools including Mt. Carmel Elementary School, Chestnut Log Middle School, and New Manchester High School.
Ownership History
Date
Name
Owned For
Owner Type
Purchase Details
Closed on
Oct 17, 2006
Sold by
Tavares Jorge E
Bought by
Vasquez-Cruz Juan R
Current Estimated Value
Home Financials for this Owner
Home Financials are based on the most recent Mortgage that was taken out on this home.
Original Mortgage
$120,000
Outstanding Balance
$71,567
Interest Rate
6.45%
Mortgage Type
New Conventional
Estimated Equity
$168,631
Purchase Details
Closed on
Jan 27, 2006
Sold by
Cannon Kimberly L
Bought by
Tavarez Jorge E
Home Financials for this Owner
Home Financials are based on the most recent Mortgage that was taken out on this home.
Original Mortgage
$102,820
Interest Rate
6.14%
Mortgage Type
New Conventional
Purchase Details
Closed on
Jul 29, 1994
Sold by
Lee J Franklin
Bought by
Keever Kimberly
Home Financials for this Owner
Home Financials are based on the most recent Mortgage that was taken out on this home.
Original Mortgage
$68,098
Interest Rate
8.53%
Mortgage Type
FHA
Create a Home Valuation Report for This Property
The Home Valuation Report is an in-depth analysis detailing your home's value as well as a comparison with similar homes in the area
Home Values in the Area
Average Home Value in this Area
Purchase History
| Date | Buyer | Sale Price | Title Company |
|---|---|---|---|
| Vasquez-Cruz Juan R | $120,000 | -- | |
| Tavarez Jorge E | $106,000 | -- | |
| Keever Kimberly | $69,700 | -- |
Source: Public Records
Mortgage History
| Date | Status | Borrower | Loan Amount |
|---|---|---|---|
| Open | Vasquez-Cruz Juan R | $120,000 | |
| Previous Owner | Tavarez Jorge E | $102,820 | |
| Previous Owner | Keever Kimberly | $68,098 |
Source: Public Records
Tax History Compared to Growth
Tax History
| Year | Tax Paid | Tax Assessment Tax Assessment Total Assessment is a certain percentage of the fair market value that is determined by local assessors to be the total taxable value of land and additions on the property. | Land | Improvement |
|---|---|---|---|---|
| 2024 | $1,807 | $75,840 | $15,920 | $59,920 |
| 2023 | $1,807 | $75,840 | $15,920 | $59,920 |
| 2022 | $1,712 | $68,240 | $13,200 | $55,040 |
| 2021 | $1,247 | $44,840 | $11,200 | $33,640 |
| 2020 | $1,290 | $46,200 | $12,640 | $33,560 |
| 2019 | $1,211 | $44,960 | $10,440 | $34,520 |
| 2018 | $1,113 | $39,960 | $9,560 | $30,400 |
| 2017 | $1,027 | $35,080 | $9,240 | $25,840 |
| 2016 | $948 | $30,960 | $8,360 | $22,600 |
| 2015 | $779 | $25,280 | $7,040 | $18,240 |
| 2014 | $630 | $20,440 | $6,040 | $14,400 |
| 2013 | -- | $23,680 | $7,040 | $16,640 |
Source: Public Records
Map
Nearby Homes
- 3159 W Point Cir
- 3721 Longview Dr
- 2280 Pope Rd
- 3580 Dorris Cir
- 3825 Bentley Dr
- 3811 Paul St
- 4912 Saint Johns Dr
- 3482 Willow Meadow Ln
- 3552 S Melissa Ln
- 2057 Terry Ln
- 2539 Slater Mill Rd
- 2627 Carol Cir
- 2529 Slater Mill Rd
- 2519 Slater Mill Rd
- 2509 Slater Mill Rd
- 2499 Slater Mill Rd
- 2709 Gentry Dr
- 0 Slater Mill Rd Unit 7591224
- 0 Slater Mill Rd Unit 10535776
- 3672 N Melissa Ln
- 3141 W Point Cir
- W W Point Cir
- 2372 Union Point Jct
- 3155 W Point Cir
- 3137 W Point Cir
- 3146 W Point Cir
- 2376 Union Point Jct
- 3142 W Point Cir
- 3133 W Point Cir
- 3150 W Point Cir
- 3159 W Point Cir
- 3176 Warrenton Ct
- 3138 W Point Cir
- 3154 W Point Cir
- 2380 Union Point Jct
- 3163 W Point Cir
- 3180 Warrenton Ct
- 0 W Point Cir Unit 3122748
- 0 W Point Cir Unit 7454285
- 0 W Point Cir