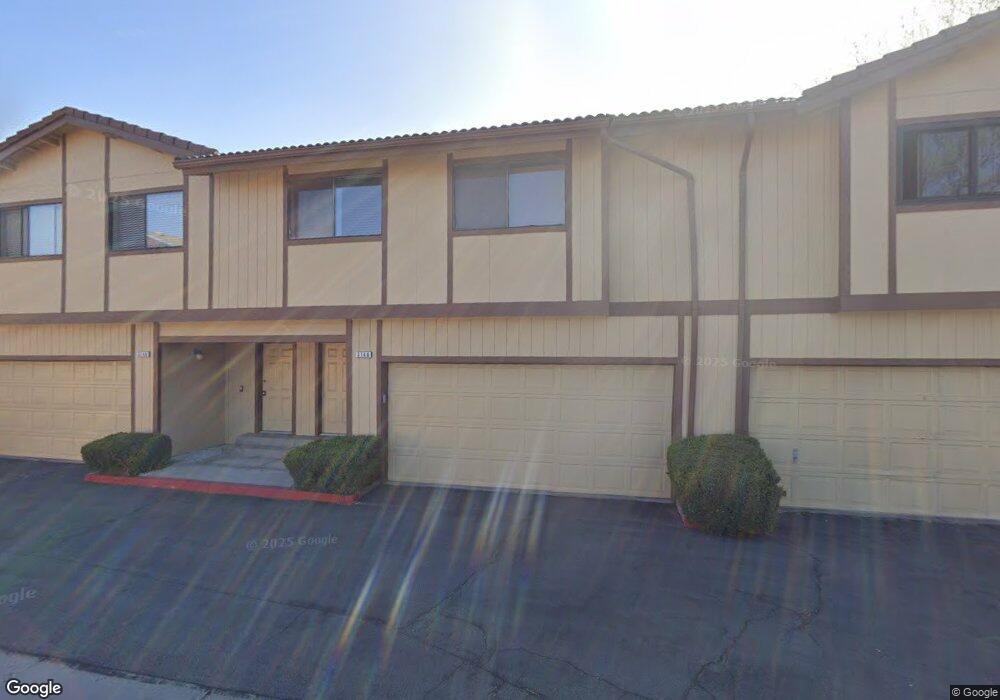
3146 N Truckee Ln Sparks, NV 89434
Reed NeighborhoodEstimated Value: $292,000 - $310,000
2
Beds
2
Baths
1,289
Sq Ft
$236/Sq Ft
Est. Value
About This Home
This home is located at 3146 N Truckee Ln, Sparks, NV 89434 and is currently estimated at $304,450, approximately $236 per square foot. 3146 N Truckee Ln is a home located in Washoe County with nearby schools including Hershal H. Beam Elementary School, Lena Juniper Elementary School, and Lou Mendive Middle School.
Ownership History
Date
Name
Owned For
Owner Type
Purchase Details
Closed on
Jun 17, 2024
Sold by
Short Melanie H
Bought by
Melanie H Short Living Trust and Short
Current Estimated Value
Purchase Details
Closed on
Apr 4, 2008
Sold by
Jp Morgan Chase Bank Na
Bought by
Short Melanie H
Home Financials for this Owner
Home Financials are based on the most recent Mortgage that was taken out on this home.
Original Mortgage
$128,877
Interest Rate
5.81%
Mortgage Type
FHA
Purchase Details
Closed on
Sep 28, 2007
Sold by
Cox Dawn M
Bought by
Jpmorgan Chase Bank Na and Certificateholders Of Bear Stearns Asset
Purchase Details
Closed on
Jun 22, 2005
Sold by
Gardner Charles R and Gardner Anne T
Bought by
Cox Dawn M
Home Financials for this Owner
Home Financials are based on the most recent Mortgage that was taken out on this home.
Original Mortgage
$219,500
Interest Rate
7.5%
Mortgage Type
Purchase Money Mortgage
Create a Home Valuation Report for This Property
The Home Valuation Report is an in-depth analysis detailing your home's value as well as a comparison with similar homes in the area
Home Values in the Area
Average Home Value in this Area
Purchase History
| Date | Buyer | Sale Price | Title Company |
|---|---|---|---|
| Melanie H Short Living Trust | -- | None Listed On Document | |
| Short Melanie H | $131,000 | Ticor Title Reno | |
| Jpmorgan Chase Bank Na | $195,500 | First Centennial Title Co | |
| Cox Dawn M | $244,000 | First Centennial Title Co |
Source: Public Records
Mortgage History
| Date | Status | Borrower | Loan Amount |
|---|---|---|---|
| Previous Owner | Short Melanie H | $128,877 | |
| Previous Owner | Cox Dawn M | $219,500 |
Source: Public Records
Tax History Compared to Growth
Tax History
| Year | Tax Paid | Tax Assessment Tax Assessment Total Assessment is a certain percentage of the fair market value that is determined by local assessors to be the total taxable value of land and additions on the property. | Land | Improvement |
|---|---|---|---|---|
| 2025 | $819 | $49,485 | $23,800 | $25,685 |
| 2024 | $819 | $49,413 | $22,540 | $26,873 |
| 2023 | $797 | $46,512 | $22,540 | $23,972 |
| 2022 | $774 | $40,542 | $19,565 | $20,977 |
| 2021 | $752 | $35,121 | $13,895 | $21,226 |
| 2020 | $728 | $35,535 | $13,895 | $21,640 |
| 2019 | $707 | $33,288 | $11,690 | $21,598 |
| 2018 | $682 | $30,063 | $8,715 | $21,348 |
| 2017 | $659 | $29,625 | $8,470 | $21,155 |
| 2016 | $644 | $28,666 | $6,825 | $21,841 |
| 2015 | $642 | $26,483 | $4,725 | $21,758 |
| 2014 | $624 | $23,753 | $3,500 | $20,253 |
| 2013 | -- | $16,357 | $2,555 | $13,802 |
Source: Public Records
Map
Nearby Homes
- 3167 Bristle Branch Dr
- 3188 Bristle Branch Dr
- 3198 Bristle Branch Dr
- 3200 Bristle Branch Dr
- 3104 Sandy St
- 3071 Meadowlands Dr
- 745 Glen Vista Dr
- 930 Spanish Springs Rd
- 120 E Lenwood Dr
- 1128 Bradley Square
- 1095 E York Way
- 913 Glen Molly Dr
- 1029 Baywood Dr Unit D
- 1069 Palmwood Dr
- 1035 Baywood Dr Unit D
- 1051 Glen Martin Dr
- 3595 Rocky Ridge Ct
- 3245 Elaine Way
- 10 Sheridan Way
- 1973 Rio Tinto Dr
- 3144 N Truckee Ln
- 3150 N Truckee Ln
- 3163 Bristle Branch Dr Unit 44
- 3165 Bristle Branch Dr
- 3132 N Truckee Ln
- 3130 N Truckee Ln
- 3128 N Truckee Ln
- 3161 Bristle Branch Dr Unit 43
- 3162 N Truckee Ln
- 3177 Bristle Branch Dr
- 3126 N Truckee Ln
- 3159 Bristle Branch Dr
- 3124 N Truckee Ln
- 3175 Bristle Branch Dr Unit 57
- 3164 N Truckee Ln
- 3179 Bristle Branch Dr
- 3114 N Truckee Ln
- 3181 Bristle Branch Dr
- 3173 Bristle Branch Dr Unit 59
- 3166 N Truckee Ln