Estimated Value: $46,000 - $65,000
2
Beds
1
Bath
832
Sq Ft
$64/Sq Ft
Est. Value
About This Home
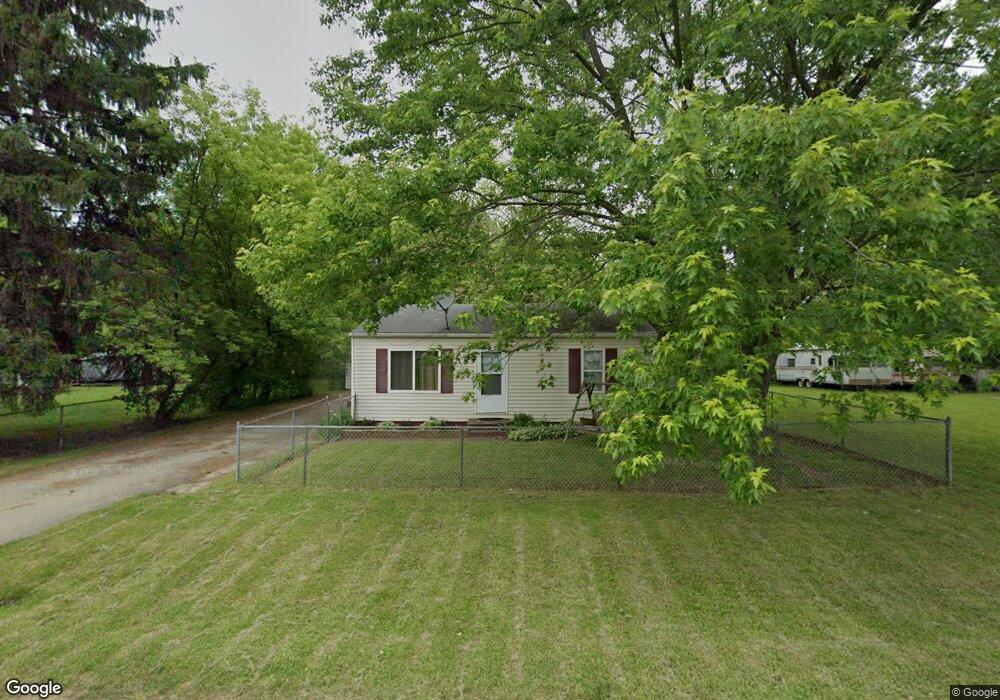
This home is located at 3146 W Hobson Ave, Flint, MI 48504 and is currently estimated at $52,895, approximately $63 per square foot. 3146 W Hobson Ave is a home located in Genesee County with nearby schools including Col. Donald McMonagle Elementary School, Hamady Community Middle/High School, and Eagle's Nest Academy.
Ownership History
Date
Name
Owned For
Owner Type
Purchase Details
Closed on
Oct 7, 2015
Sold by
Cherry Deborah L
Bought by
Romanack Daniel Mark
Current Estimated Value
Purchase Details
Closed on
Oct 2, 2012
Sold by
Foreclosure Holdings Inc
Bought by
The Spurr Family Trust
Purchase Details
Closed on
Mar 29, 2010
Sold by
Wothke Matthew J and Wothke Staci
Bought by
Foreclosure Holdings Inc
Purchase Details
Closed on
Feb 1, 2010
Sold by
American Mortgage Professionals Inc
Bought by
Wothke Matthew J
Purchase Details
Closed on
Aug 14, 2008
Sold by
Fortuno Inc
Bought by
American Mortgage Professionals Inc
Purchase Details
Closed on
Jul 7, 2008
Sold by
Hsbc Bank Usa
Bought by
Homes Under 10K Inc
Purchase Details
Closed on
Nov 21, 2007
Sold by
Haacker Brian J and Haacker Theresa M
Bought by
Hsbc Bank Usa and Citigroup Mortgage Loan Trust Inc Asset
Purchase Details
Closed on
Jun 21, 2000
Sold by
Balyeat Charles E
Bought by
Haacker Brian J and Haacker Theresa M
Create a Home Valuation Report for This Property
The Home Valuation Report is an in-depth analysis detailing your home's value as well as a comparison with similar homes in the area
Home Values in the Area
Average Home Value in this Area
Purchase History
| Date | Buyer | Sale Price | Title Company |
|---|---|---|---|
| Romanack Daniel Mark | $2,903 | Attorney | |
| The Spurr Family Trust | -- | None Available | |
| Foreclosure Holdings Inc | $11,000 | Cislo Title Co | |
| Wothke Matthew J | -- | None Available | |
| American Mortgage Professionals Inc | $30,000 | Guaranty Title Company | |
| Homes Under 10K Inc | $8,000 | Attorneys Title Agency Llc | |
| Hsbc Bank Usa | $27,806 | None Available | |
| Haacker Brian J | $30,000 | Guaranty Title Company |
Source: Public Records
Tax History Compared to Growth
Tax History
| Year | Tax Paid | Tax Assessment Tax Assessment Total Assessment is a certain percentage of the fair market value that is determined by local assessors to be the total taxable value of land and additions on the property. | Land | Improvement |
|---|---|---|---|---|
| 2025 | $621 | $23,300 | $0 | $0 |
| 2024 | $120 | $21,300 | $0 | $0 |
| 2023 | $114 | $17,400 | $0 | $0 |
| 2022 | $551 | $15,200 | $0 | $0 |
| 2021 | $548 | $13,400 | $0 | $0 |
| 2020 | $104 | $12,700 | $0 | $0 |
| 2019 | $103 | $10,200 | $0 | $0 |
| 2018 | $701 | $8,700 | $0 | $0 |
| 2017 | $696 | $8,500 | $0 | $0 |
| 2016 | $485 | $8,400 | $0 | $0 |
| 2015 | $336 | $8,500 | $0 | $0 |
| 2014 | $92 | $8,300 | $0 | $0 |
| 2012 | -- | $9,700 | $9,700 | $0 |
Source: Public Records
Map
Nearby Homes
- 0 Gracelawn Ave
- VL W Parkway Ave
- 2017 Chateau Dr
- 6414 Valorie Ln
- 5806 Marlowe Dr
- 5620 Marlowe Dr
- 4217 Oconner Rd
- 3271 W Carpenter Rd
- 1709 W Home Ave
- 1902 Marlowe Dr
- 5616 Griggs Dr
- 5106 Cloverlawn Dr
- 1625 Barbara Dr
- 5031 Clio Rd
- 1720 Marlowe Dr
- 4039 Oconner Rd
- 1605 Barbara Dr
- 1816 Russet Place
- 1913 Cherrylawn Dr
- 3330 Maywood Dr
- 3140 W Hobson Ave
- 3156 W Hobson Ave
- 4227 Orgould St
- 3145 W Hobson Ave
- 3162 W Hobson Ave
- 3149 W Hobson Ave
- 3139 W Hobson Ave
- 3168 W Hobson Ave
- 3167 W Home Ave
- 3167 W Home Ave
- 3163 W Hobson Ave
- 3144 W Home Ave
- 3148 W Gracelawn Ave
- 3142 W Gracelawn Ave
- 3173 W Home Ave
- 3175 W Hobson Ave
- 3174 W Hobson Ave
- 3177 W Home Ave
- 3152 W Home Ave
- 3162 W Gracelawn Ave