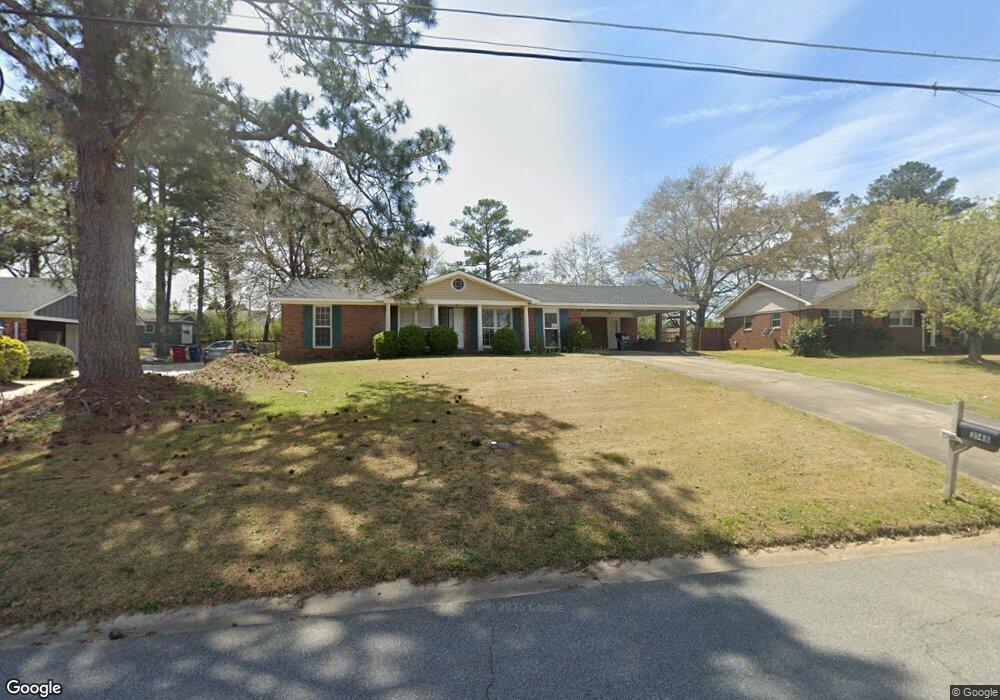
3148 Clairmont Ave Macon, GA 31204
Estimated Value: $170,000 - $209,000
3
Beds
2
Baths
1,464
Sq Ft
$131/Sq Ft
Est. Value
About This Home
This home is located at 3148 Clairmont Ave, Macon, GA 31204 and is currently estimated at $191,514, approximately $130 per square foot. 3148 Clairmont Ave is a home located in Bibb County with nearby schools including Rosa Taylor Elementary School, Howard Middle School, and Howard High School.
Ownership History
Date
Name
Owned For
Owner Type
Purchase Details
Closed on
Aug 1, 2022
Sold by
Givans Alex A
Bought by
Sardoma Noel
Current Estimated Value
Home Financials for this Owner
Home Financials are based on the most recent Mortgage that was taken out on this home.
Original Mortgage
$166,250
Outstanding Balance
$158,865
Interest Rate
5.78%
Mortgage Type
New Conventional
Estimated Equity
$32,649
Purchase Details
Closed on
Jun 22, 2015
Sold by
Givans Alex A
Bought by
Tom Remodeling And Housing Llc
Purchase Details
Closed on
Dec 12, 2014
Sold by
Tang Huanbin
Bought by
Tom Remodeling And Housing Llc
Purchase Details
Closed on
Apr 21, 2010
Sold by
Fannie Mae
Bought by
Tang Huanbin
Purchase Details
Closed on
Jul 9, 2009
Sold by
Wells Fargo Bank Na
Bought by
Federal Natl Mortg Assoc
Purchase Details
Closed on
Jul 7, 2009
Sold by
Mitchell Cynthia A
Bought by
Wells Fargo Bank Na
Create a Home Valuation Report for This Property
The Home Valuation Report is an in-depth analysis detailing your home's value as well as a comparison with similar homes in the area
Home Values in the Area
Average Home Value in this Area
Purchase History
| Date | Buyer | Sale Price | Title Company |
|---|---|---|---|
| Sardoma Noel | $175,000 | None Listed On Document | |
| Tom Remodeling And Housing Llc | -- | None Available | |
| Givans Alex A | $62,000 | None Available | |
| Tom Remodeling And Housing Llc | -- | None Available | |
| Tang Huanbin | $52,500 | None Available | |
| Federal Natl Mortg Assoc | -- | -- | |
| Wells Fargo Bank Na | $97,600 | -- | |
| Federal National Mortgage Association | $97,631 | None Available | |
| Wells Fargo Bank Na | $97,630 | None Available |
Source: Public Records
Mortgage History
| Date | Status | Borrower | Loan Amount |
|---|---|---|---|
| Open | Sardoma Noel | $166,250 |
Source: Public Records
Tax History Compared to Growth
Tax History
| Year | Tax Paid | Tax Assessment Tax Assessment Total Assessment is a certain percentage of the fair market value that is determined by local assessors to be the total taxable value of land and additions on the property. | Land | Improvement |
|---|---|---|---|---|
| 2025 | $1,305 | $60,109 | $12,960 | $47,149 |
| 2024 | $1,439 | $63,661 | $12,960 | $50,701 |
| 2023 | $924 | $61,399 | $12,960 | $48,439 |
| 2022 | $1,898 | $54,811 | $7,947 | $46,864 |
| 2021 | $1,970 | $51,838 | $7,947 | $43,891 |
| 2020 | $1,772 | $45,637 | $6,502 | $39,135 |
| 2019 | $1,617 | $41,315 | $6,502 | $34,813 |
| 2018 | $2,346 | $36,134 | $5,780 | $30,354 |
| 2017 | $1,323 | $35,320 | $6,452 | $28,868 |
| 2016 | $858 | $32,347 | $6,452 | $25,895 |
| 2015 | $1,749 | $35,708 | $7,259 | $28,449 |
| 2014 | $584 | $35,708 | $7,259 | $28,449 |
Source: Public Records
Map
Nearby Homes
- 957 Laurel Oak Ct
- 954 Greystone Ct
- 1051 Clairmont Place
- 3150 Misty Valley Ct
- 1017 Clifton Dr
- 1031 Clifton Dr
- 3077 River Ridge Dr
- 161 Ten Knolls Dr
- 3500 Northside Dr
- 1246 Newport Rd
- 2958 Glenrock Dr
- 770 Windsor Rd
- 1197 Matthews Place
- 3602 Northside Dr
- 3622 Northside Dr
- 2916 Southshore Dr
- 1068 S Pine Knoll Dr
- 3640 Northside Dr
- 2945 Crestline Dr
- 3678 Northside Dr
- 3156 Clairmont Ave
- 3140 Clairmont Ave
- 3138 Clairmont Ave
- 3134 Clairmont Ave
- 3166 Clairmont Ave
- 951 Clairmont Place
- 957 Clairmont Place
- 945 Clairmont Place
- 963 Clairmont Place
- 939 Clairmont Place Unit 358
- 3143 Clairmont Ave
- 3151 Clairmont Ave
- 3122 Clairmont Ave
- 933 Clairmont Place
- 3163 Clairmont Ave
- 3135 Clairmont Ave
- 3174 Clairmont Ave
- 927 Clairmont Place
- 3123 Clairmont Ave
- 3175 Clairmont Ave