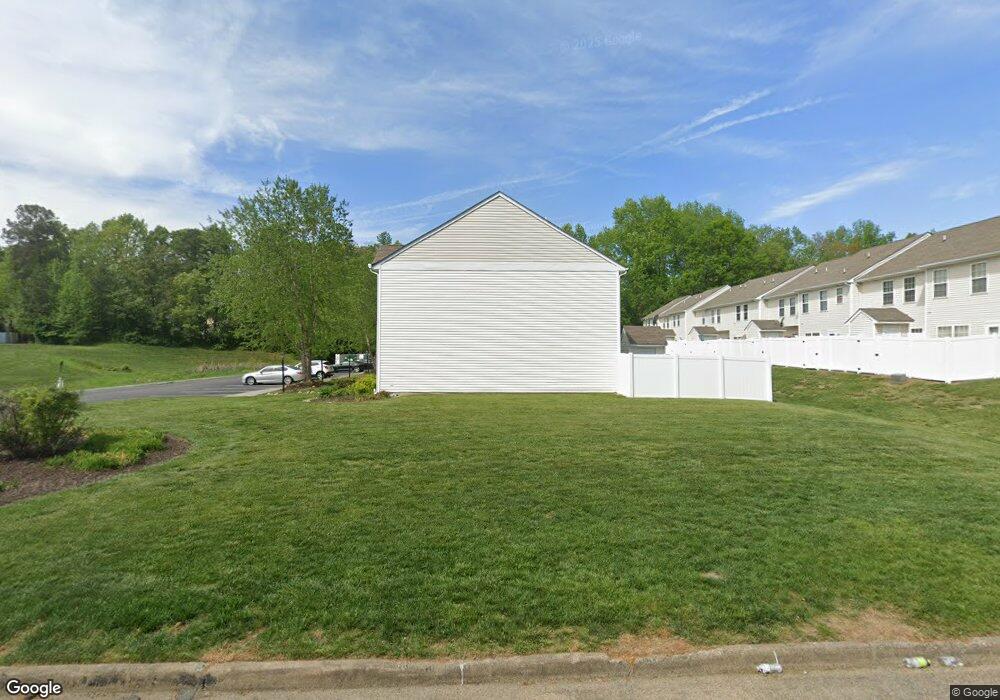
3148 Kim Dr Unit 5 North Chesterfield, VA 23224
North Chesterfield NeighborhoodEstimated Value: $228,000 - $255,203
3
Beds
3
Baths
1,254
Sq Ft
$189/Sq Ft
Est. Value
About This Home
This home is located at 3148 Kim Dr Unit 5, North Chesterfield, VA 23224 and is currently estimated at $237,551, approximately $189 per square foot. 3148 Kim Dr Unit 5 is a home located in Chesterfield County with nearby schools including J.A. Chalkley Elementary School, Providence Middle School, and Manchester High.
Ownership History
Date
Name
Owned For
Owner Type
Purchase Details
Closed on
May 24, 2021
Sold by
Battle Natalie
Bought by
Gary Pamela A
Current Estimated Value
Home Financials for this Owner
Home Financials are based on the most recent Mortgage that was taken out on this home.
Original Mortgage
$7,500
Outstanding Balance
$6,796
Interest Rate
2.95%
Mortgage Type
New Conventional
Estimated Equity
$230,755
Purchase Details
Closed on
Nov 4, 2009
Sold by
Kidd Lisa M
Bought by
Battle Natalie
Home Financials for this Owner
Home Financials are based on the most recent Mortgage that was taken out on this home.
Original Mortgage
$128,627
Interest Rate
5.06%
Mortgage Type
FHA
Purchase Details
Closed on
Nov 14, 2005
Sold by
Craftmaster Homes L L C
Bought by
Kidd Lisa M
Home Financials for this Owner
Home Financials are based on the most recent Mortgage that was taken out on this home.
Original Mortgage
$142,550
Interest Rate
6.39%
Mortgage Type
New Conventional
Create a Home Valuation Report for This Property
The Home Valuation Report is an in-depth analysis detailing your home's value as well as a comparison with similar homes in the area
Home Values in the Area
Average Home Value in this Area
Purchase History
| Date | Buyer | Sale Price | Title Company |
|---|---|---|---|
| Gary Pamela A | $187,000 | Appomattox Title Company Inc | |
| Battle Natalie | $131,000 | -- | |
| Kidd Lisa M | $142,550 | -- |
Source: Public Records
Mortgage History
| Date | Status | Borrower | Loan Amount |
|---|---|---|---|
| Open | Gary Pamela A | $7,500 | |
| Open | Gary Pamela A | $183,612 | |
| Previous Owner | Battle Natalie | $128,627 | |
| Previous Owner | Kidd Lisa M | $142,550 |
Source: Public Records
Tax History Compared to Growth
Tax History
| Year | Tax Paid | Tax Assessment Tax Assessment Total Assessment is a certain percentage of the fair market value that is determined by local assessors to be the total taxable value of land and additions on the property. | Land | Improvement |
|---|---|---|---|---|
| 2025 | $2,020 | $226,100 | $39,500 | $186,600 |
| 2024 | $2,020 | $221,700 | $34,000 | $187,700 |
| 2023 | $1,792 | $196,900 | $34,000 | $162,900 |
| 2022 | $1,668 | $181,300 | $31,000 | $150,300 |
| 2021 | $1,534 | $160,700 | $30,000 | $130,700 |
| 2020 | $1,376 | $144,800 | $29,000 | $115,800 |
| 2019 | $1,245 | $131,100 | $28,000 | $103,100 |
| 2018 | $1,162 | $121,500 | $26,000 | $95,500 |
| 2017 | $1,162 | $120,300 | $26,000 | $94,300 |
| 2016 | $1,141 | $118,900 | $26,000 | $92,900 |
| 2015 | $1,064 | $110,800 | $26,000 | $84,800 |
| 2014 | $1,022 | $106,500 | $26,000 | $80,500 |
Source: Public Records
Map
Nearby Homes
- 6512 N Stevens Hollow Dr
- 3014 Kim Dr
- 3604 Stevens Wood Ct
- 3104 S Battlebridge Dr
- 6026 Partingdale Cir
- 3807 Belker Ct
- 3825 Belker Ct
- 2709 Twain Ln
- 6450 Holborn Rd
- 3900 Bridget Ct
- 3136 Turner Rd
- 3800 Grizzard Dr
- 3285 Ghent Dr
- 6551 West Rd
- 2517 Lancers Blvd
- 3108 Johns Way
- 3112 Johns Way
- 5511 Belle Pond Dr
- 3109 Johns Way
- 5400 Belmont Rd
- 3148 Kim Dr
- 3148 Kim Dr Unit 3148
- 3146 Kim Dr
- 3146 Kim Dr Unit 4
- 3150 Kim Dr
- 3150 Kim Dr Unit N/A
- 3150 Kim Dr Unit 6
- 3144 Kim Dr
- 3144 Kim Dr
- 3144 Kim Dr Unit 3
- 3152 Kim Dr Unit 3152
- 3152 Kim Dr Unit 7
- 3142 Kim Dr
- 3142 Kim Dr Unit 2
- 3154 Kim Dr
- 3154 Kim Dr
- 3154 Kim Dr Unit 3154
- 3154 Kim Dr Unit 8
- 3156 Kim Dr
- 3156 Kim Dr Unit 9