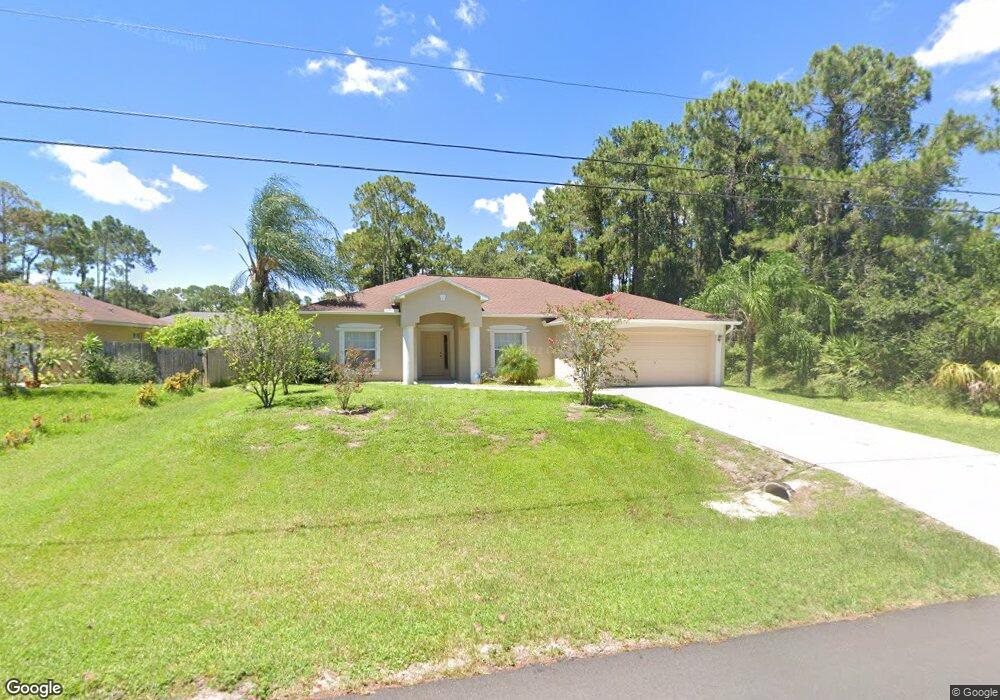
3148 Tishman Ave North Port, FL 34286
Estimated Value: $290,298 - $333,000
3
Beds
2
Baths
1,832
Sq Ft
$173/Sq Ft
Est. Value
About This Home
This home is located at 3148 Tishman Ave, North Port, FL 34286 and is currently estimated at $316,825, approximately $172 per square foot. 3148 Tishman Ave is a home located in Sarasota County with nearby schools including North Port High School, Lamarque Elementary School, and Woodland Middle School.
Ownership History
Date
Name
Owned For
Owner Type
Purchase Details
Closed on
Mar 10, 2017
Sold by
Burlyga Larisa L
Bought by
Burlyga Larisa L and Burlyga Mikhail
Current Estimated Value
Purchase Details
Closed on
Sep 26, 2006
Sold by
Holiday Builders Inc
Bought by
Burlyga Larisa L
Home Financials for this Owner
Home Financials are based on the most recent Mortgage that was taken out on this home.
Original Mortgage
$188,000
Interest Rate
6.48%
Mortgage Type
Purchase Money Mortgage
Purchase Details
Closed on
Dec 23, 2005
Sold by
Burlyga Larisa
Bought by
Holiday Builders Inc
Purchase Details
Closed on
Feb 24, 2005
Sold by
Dzwinka Michael
Bought by
Burlyga Larisa
Purchase Details
Closed on
Mar 26, 2004
Sold by
Yance Esther G
Bought by
Desyatnikova Olga
Create a Home Valuation Report for This Property
The Home Valuation Report is an in-depth analysis detailing your home's value as well as a comparison with similar homes in the area
Home Values in the Area
Average Home Value in this Area
Purchase History
| Date | Buyer | Sale Price | Title Company |
|---|---|---|---|
| Burlyga Larisa L | $83,500 | Attorney | |
| Burlyga Larisa L | $251,400 | Hbi Title Company | |
| Holiday Builders Inc | $29,900 | Lawyers Title Ins | |
| Burlyga Larisa | $29,900 | Hoy Title Services Inc | |
| Desyatnikova Olga | $12,600 | Executive Title Ins Svcs Inc |
Source: Public Records
Mortgage History
| Date | Status | Borrower | Loan Amount |
|---|---|---|---|
| Previous Owner | Burlyga Larisa L | $188,000 |
Source: Public Records
Tax History Compared to Growth
Tax History
| Year | Tax Paid | Tax Assessment Tax Assessment Total Assessment is a certain percentage of the fair market value that is determined by local assessors to be the total taxable value of land and additions on the property. | Land | Improvement |
|---|---|---|---|---|
| 2024 | $4,579 | $250,894 | -- | -- |
| 2023 | $4,579 | $292,300 | $15,300 | $277,000 |
| 2022 | $4,286 | $272,600 | $21,000 | $251,600 |
| 2021 | $3,646 | $188,500 | $10,200 | $178,300 |
| 2020 | $3,449 | $174,400 | $9,700 | $164,700 |
| 2019 | $3,397 | $174,400 | $9,200 | $165,200 |
| 2018 | $3,053 | $165,000 | $8,700 | $156,300 |
| 2017 | $2,914 | $139,953 | $0 | $0 |
| 2016 | $2,717 | $141,600 | $4,800 | $136,800 |
| 2015 | $2,506 | $119,300 | $4,300 | $115,000 |
| 2014 | $2,342 | $95,590 | $0 | $0 |
Source: Public Records
Map
Nearby Homes
- LOT 5, Albren St
- 3165 Stockton Ave
- 0 Traverse Ave Unit MFRA4655291
- 0 Traverse Ave Unit MFRA4640488
- 3083 Sikeston Ave
- 3325 Stockton Ave
- 2968 Traverse Ave
- 3003 Sikeston Ave
- 2942 Traverse Ave
- LOT 19 & LOT 20 Tusket Ave
- 3323 Sikeston Ave
- 1865 Rival Terrace
- 1835 Rival Terrace
- 0 Oklahoma St
- 2852 Alling Terrace
- 2968 Yacolt Ave
- 2799 Strawberry Terrace
- 0 Tucson Rd Unit MFRA4670637
- 0 Slayton Ave
- 0 Rival Terrace Unit MFRC7510986
- 3168 Tishman Ave
- 3163 Taunton Ave
- 3188 Tishman Ave
- 3108 Tishman Ave
- 3149 Tishman Ave
- 3129 Tishman Ave
- 3109 Tishman Ave
- 3193 Taunton Ave
- 3208 Tishman Ave
- 3083 Taunton Ave
- 0 Taunton Ave Unit A4408521
- 0 Taunton Ave Unit A4404691
- 0 Taunton Ave Unit C7401146
- 0 Taunton Ave Unit C7401065
- 0 Taunton Ave Unit MFRA4610234
- 0 Taunton Ave Unit D6127428
- 0 Taunton Ave Unit A4523283
- 0 Taunton Ave Unit N6116672
- 0 Taunton Ave Unit 220048641
- 0 Taunton Ave Unit C7428428