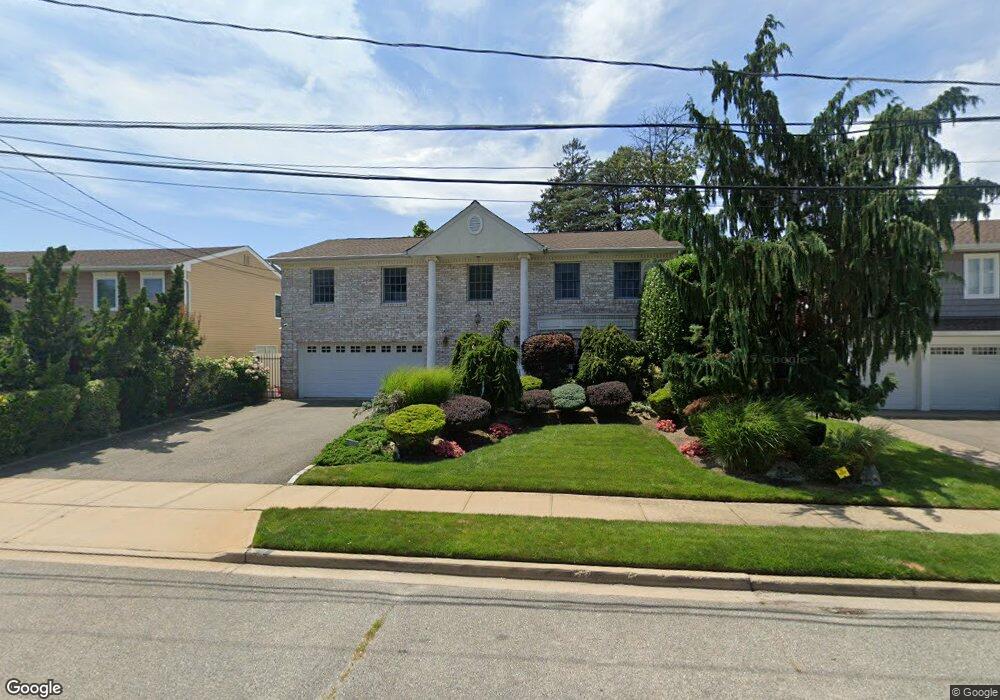
3148 Wynsum Ave Merrick, NY 11566
Estimated Value: $1,117,568 - $1,286,000
4
Beds
3
Baths
2,801
Sq Ft
$429/Sq Ft
Est. Value
About This Home
This home is located at 3148 Wynsum Ave, Merrick, NY 11566 and is currently estimated at $1,201,784, approximately $429 per square foot. 3148 Wynsum Ave is a home located in Nassau County with nearby schools including Merrick Avenue Middle School, John F. Kennedy High School, and Roosevelt Children's Academy.
Ownership History
Date
Name
Owned For
Owner Type
Purchase Details
Closed on
Jul 7, 2017
Sold by
Plutno Martin L and Plutno Rose Anne
Bought by
Pinkhasov Arkadiy and Bespalko Olivia
Current Estimated Value
Home Financials for this Owner
Home Financials are based on the most recent Mortgage that was taken out on this home.
Original Mortgage
$680,000
Outstanding Balance
$564,965
Interest Rate
3.89%
Mortgage Type
New Conventional
Estimated Equity
$636,819
Purchase Details
Closed on
Jul 12, 2001
Sold by
Goldstein Ellen
Bought by
Plutno Martin
Create a Home Valuation Report for This Property
The Home Valuation Report is an in-depth analysis detailing your home's value as well as a comparison with similar homes in the area
Home Values in the Area
Average Home Value in this Area
Purchase History
| Date | Buyer | Sale Price | Title Company |
|---|---|---|---|
| Pinkhasov Arkadiy | $850,000 | Fidelity National Title Insu | |
| Plutno Martin | $495,000 | Michael Mirotznik |
Source: Public Records
Mortgage History
| Date | Status | Borrower | Loan Amount |
|---|---|---|---|
| Open | Pinkhasov Arkadiy | $680,000 |
Source: Public Records
Tax History
| Year | Tax Paid | Tax Assessment Tax Assessment Total Assessment is a certain percentage of the fair market value that is determined by local assessors to be the total taxable value of land and additions on the property. | Land | Improvement |
|---|---|---|---|---|
| 2025 | $21,066 | $694 | $245 | $449 |
| 2024 | $4,833 | $705 | $249 | $456 |
Source: Public Records
Map
Nearby Homes
- 2074 Ellen Dr
- 3311 Hewlett Ave
- 2876 Shore Rd
- 2858 Shore Rd
- 3142 Shore Rd
- 2988 Lee Place
- 2066 Holland Way
- 3058 Susan Rd
- 2884 Bay Dr
- 2070 Beverly Way
- 2845 Whaleneck Dr
- 2829 Frankel Blvd
- 2863 Harbor Rd
- 3200 Lydia Ln
- 2072 Brighton Way
- 2794 Lincoln Blvd
- 1993 Lowell Ln
- 1981 Cynthia Ln
- 110 Hampton Way
- 2631 Rachel St
Your Personal Tour Guide
Ask me questions while you tour the home.