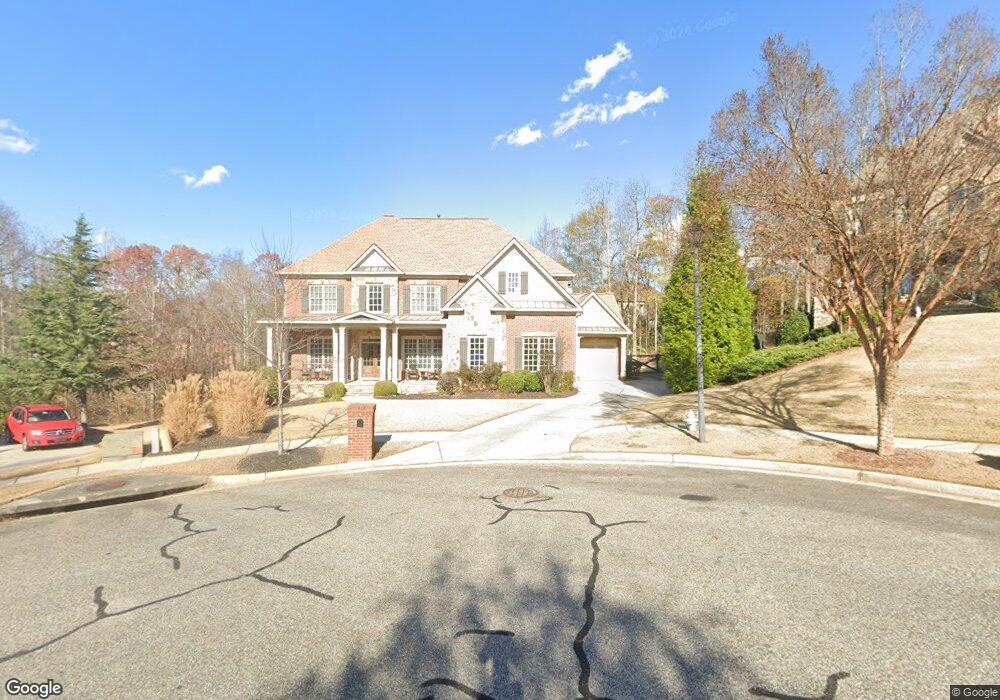
3149 Hidden Falls Dr Buford, GA 30519
Estimated Value: $962,000 - $1,034,000
5
Beds
4
Baths
3,717
Sq Ft
$270/Sq Ft
Est. Value
About This Home
This home is located at 3149 Hidden Falls Dr, Buford, GA 30519 and is currently estimated at $1,004,087, approximately $270 per square foot. 3149 Hidden Falls Dr is a home located in Gwinnett County with nearby schools including Patrick Elementary School and Glenn C. Jones Middle School.
Ownership History
Date
Name
Owned For
Owner Type
Purchase Details
Closed on
Sep 12, 2025
Sold by
Deardorff Burt M
Bought by
Wall Erin and Wall Ryan
Current Estimated Value
Home Financials for this Owner
Home Financials are based on the most recent Mortgage that was taken out on this home.
Original Mortgage
$804,000
Outstanding Balance
$803,284
Interest Rate
6.58%
Mortgage Type
New Conventional
Estimated Equity
$200,803
Purchase Details
Closed on
Dec 12, 2007
Sold by
Deardorff Burt M
Bought by
Deardorff Burt M and Deardorff Sherri Y
Home Financials for this Owner
Home Financials are based on the most recent Mortgage that was taken out on this home.
Original Mortgage
$499,700
Interest Rate
6.75%
Mortgage Type
New Conventional
Purchase Details
Closed on
Dec 7, 2007
Sold by
G & I Construction Llc
Bought by
Glen Huff Homes Llc
Home Financials for this Owner
Home Financials are based on the most recent Mortgage that was taken out on this home.
Original Mortgage
$499,700
Interest Rate
6.75%
Mortgage Type
New Conventional
Purchase Details
Closed on
Mar 7, 2005
Sold by
Jim Cowart Residential Llc
Bought by
Grizzard Homes Inc
Home Financials for this Owner
Home Financials are based on the most recent Mortgage that was taken out on this home.
Original Mortgage
$408,750
Interest Rate
5.6%
Create a Home Valuation Report for This Property
The Home Valuation Report is an in-depth analysis detailing your home's value as well as a comparison with similar homes in the area
Home Values in the Area
Average Home Value in this Area
Purchase History
| Date | Buyer | Sale Price | Title Company |
|---|---|---|---|
| Wall Erin | $1,016,875 | -- | |
| Deardorff Burt M | $526,000 | -- | |
| Deardorff Burt M | $526,000 | -- | |
| Glen Huff Homes Llc | $135,000 | -- | |
| G & I Construction Llc | $125,000 | -- | |
| Grizzard Homes Inc | $205,800 | -- |
Source: Public Records
Mortgage History
| Date | Status | Borrower | Loan Amount |
|---|---|---|---|
| Open | Wall Erin | $804,000 | |
| Previous Owner | Deardorff Burt M | $499,700 | |
| Previous Owner | Grizzard Homes Inc | $408,750 |
Source: Public Records
Tax History Compared to Growth
Tax History
| Year | Tax Paid | Tax Assessment Tax Assessment Total Assessment is a certain percentage of the fair market value that is determined by local assessors to be the total taxable value of land and additions on the property. | Land | Improvement |
|---|---|---|---|---|
| 2024 | $9,105 | $313,720 | $62,000 | $251,720 |
| 2023 | $9,105 | $298,280 | $62,000 | $236,280 |
| 2022 | $8,030 | $262,720 | $54,400 | $208,320 |
| 2021 | $7,034 | $208,480 | $46,400 | $162,080 |
| 2020 | $6,747 | $192,920 | $38,000 | $154,920 |
| 2019 | $0 | $192,920 | $38,000 | $154,920 |
| 2018 | $6,547 | $192,920 | $38,000 | $154,920 |
| 2016 | $6,576 | $189,400 | $38,000 | $151,400 |
| 2015 | $6,332 | $180,480 | $38,000 | $142,480 |
| 2014 | -- | $180,480 | $38,000 | $142,480 |
Source: Public Records
Map
Nearby Homes
- 2551 Kilgore Rd
- 3302 Anna Ruby Ln
- 2550 Kilgore Rd
- 2452 Kilgore Rd
- 2581 Trailing Ivy Way
- 3568 Foxworth Ct
- 2395 Kilgore Rd
- 2718 Kilgore Rd
- 2330 Chandler Grove Dr
- 3123 Walkers Falls Way
- 2372 Wood Beil Ct
- 2710 Kilgore Rd
- 3379 Camp Branch Rd
- 2687 Black Fox Ct
- 2789 Kilgore Rd
- 2372 Walkers Glen Ln
- The Aspen A Plan at Fern Hollow
- The Hickory F Plan at Fern Hollow
- The Danbury J Plan at Fern Hollow
- 2381 Walkers Glen Ln Unit 2C
- 3138 Hidden Falls Dr
- 3139 Hidden Falls Dr
- 3474 Hidden Shoals Rd Unit 3474
- 3474 Hidden Shoals Rd
- 3474 Hidden Shoals Rd Unit 3
- 3464 Hidden Shoals Rd
- 2688 Dukes Creek Landing
- 3129 Hidden Falls Dr
- 3454 Hidden Shoals Rd
- 3484 Hidden Shoals Rd
- 2679 Dukes Creek Landing
- 3444 Hidden Shoals Rd
- 2708 Dukes Creek Landing NE
- 3118 Hidden Falls Dr
- 3079 Hidden Falls Dr Unit 406
- 3079 Hidden Falls Dr
- 3465 Hidden Shoals Rd
- 3475 Hidden Shoals Rd
- 3463 Desoto Ridge Trail
- 3079 Hidden Falls Dr NE