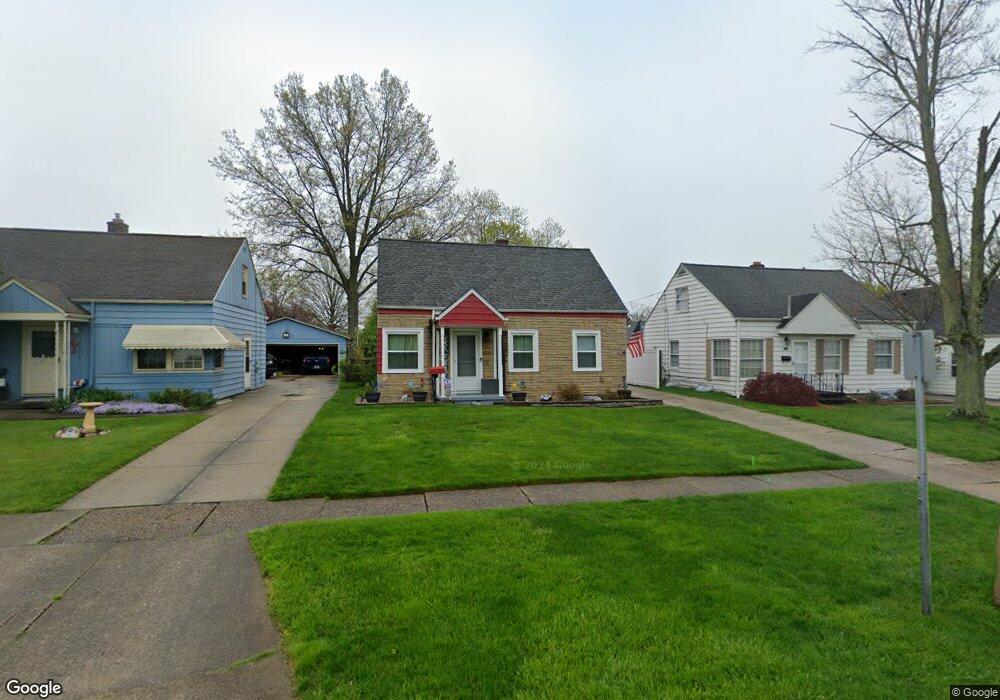
3149 Oakwood Dr Cuyahoga Falls, OH 44221
Mud Brook NeighborhoodEstimated Value: $164,000 - $203,000
3
Beds
1
Bath
1,008
Sq Ft
$183/Sq Ft
Est. Value
About This Home
This home is located at 3149 Oakwood Dr, Cuyahoga Falls, OH 44221 and is currently estimated at $184,742, approximately $183 per square foot. 3149 Oakwood Dr is a home located in Summit County with nearby schools including Lincoln Elementary School, Roberts Middle School, and Cuyahoga Falls High School.
Ownership History
Date
Name
Owned For
Owner Type
Purchase Details
Closed on
May 23, 2017
Sold by
Hosterman Marie R and Hosterman Frank Locke
Bought by
Hosterman Marie R
Current Estimated Value
Home Financials for this Owner
Home Financials are based on the most recent Mortgage that was taken out on this home.
Original Mortgage
$64,020
Outstanding Balance
$33,051
Interest Rate
3.87%
Mortgage Type
FHA
Estimated Equity
$151,691
Purchase Details
Closed on
Mar 25, 2009
Sold by
Grace Michael P and Grace Cynthia M
Bought by
Johnsen Marie R
Home Financials for this Owner
Home Financials are based on the most recent Mortgage that was taken out on this home.
Original Mortgage
$73,641
Interest Rate
5.11%
Mortgage Type
FHA
Purchase Details
Closed on
Nov 21, 2008
Sold by
Us Bank National Association
Bought by
Grace Michael P and Grace Cynthia M
Purchase Details
Closed on
May 12, 2008
Sold by
Williams Diana
Bought by
Us Bank Na and Residential Finance Trust Mortgage Loan
Purchase Details
Closed on
Dec 27, 2004
Sold by
Williams Annie R
Bought by
Grimes Karen and Williams Diana
Create a Home Valuation Report for This Property
The Home Valuation Report is an in-depth analysis detailing your home's value as well as a comparison with similar homes in the area
Home Values in the Area
Average Home Value in this Area
Purchase History
| Date | Buyer | Sale Price | Title Company |
|---|---|---|---|
| Hosterman Marie R | -- | None Available | |
| Johnsen Marie R | $75,000 | Oldstone Title Agency | |
| Grace Michael P | $60,000 | Oldstone Title Agency | |
| Us Bank Na | $75,000 | None Available | |
| Grimes Karen | -- | -- |
Source: Public Records
Mortgage History
| Date | Status | Borrower | Loan Amount |
|---|---|---|---|
| Open | Hosterman Marie R | $64,020 | |
| Closed | Johnsen Marie R | $73,641 |
Source: Public Records
Tax History Compared to Growth
Tax History
| Year | Tax Paid | Tax Assessment Tax Assessment Total Assessment is a certain percentage of the fair market value that is determined by local assessors to be the total taxable value of land and additions on the property. | Land | Improvement |
|---|---|---|---|---|
| 2025 | $2,712 | $50,236 | $11,078 | $39,158 |
| 2024 | $2,712 | $50,236 | $11,078 | $39,158 |
| 2023 | $2,712 | $50,236 | $11,078 | $39,158 |
| 2022 | $2,504 | $37,668 | $8,208 | $29,460 |
| 2021 | $2,503 | $37,668 | $8,208 | $29,460 |
| 2020 | $2,463 | $37,670 | $8,210 | $29,460 |
| 2019 | $2,331 | $32,470 | $7,880 | $24,590 |
| 2018 | $1,979 | $32,470 | $7,880 | $24,590 |
| 2017 | $1,712 | $32,470 | $7,880 | $24,590 |
| 2016 | $1,713 | $28,460 | $7,880 | $20,580 |
| 2015 | $1,712 | $28,460 | $7,880 | $20,580 |
| 2014 | $1,712 | $28,460 | $7,880 | $20,580 |
| 2013 | $1,698 | $28,460 | $7,880 | $20,580 |
Source: Public Records
Map
Nearby Homes
- 324 Madison Ave
- 418 Hayes Ave
- 229 Hayes Ave
- 3166 7th St
- 242 Monroe Ave
- 223 Filmore Ave
- 3119 Meier Place
- 3044 Bailey Rd
- 2873 Oakwood Dr
- 3106 Prior Dr
- 2876 9th St
- 336 Graham Rd
- 2890 Bailey Rd
- 2762 Elmwood St
- 921 Lincoln Ave
- 3452 Wyoga Lake Rd
- 306 Hollywood Ave
- 2736 Maplewood St
- 2886 Norwood St
- 2835 Bailey Rd
- 3155 Oakwood Dr
- 3143 Oakwood Dr
- 420 Madison Ave
- 421 Adams Ave
- 412 Madison Ave
- 413 Adams Ave
- 406 Madison Ave
- 407 Adams Ave
- 421 Madison Ave
- 3150 Oakwood Dr
- 400 Madison Ave
- 3156 Oakwood Dr
- 401 Adams Ave
- 3144 Oakwood Dr
- 3162 Oakwood Dr
- 3138 Oakwood Dr
- 420 Adams Ave
- 416 Adams Ave
- 3177 Oakwood Dr
- 412 Adams Ave